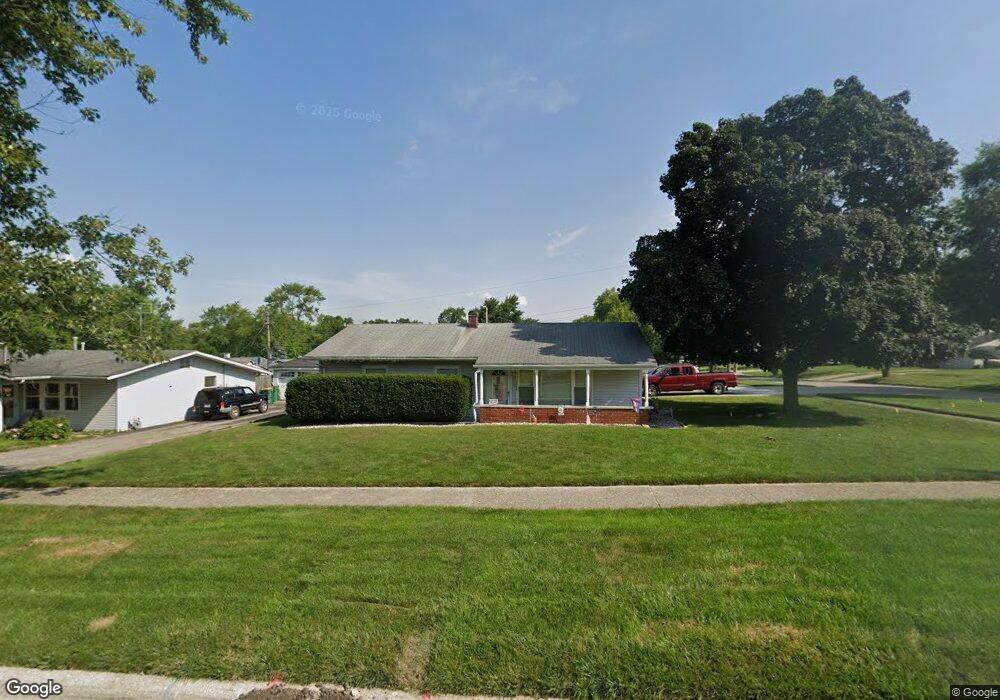
1004 Highland Ave Unit 1 Lockport, IL 60441
Estimated Value: $225,237 - $257,000
--
Bed
--
Bath
960
Sq Ft
$253/Sq Ft
Est. Value
About This Home
This home is located at 1004 Highland Ave Unit 1, Lockport, IL 60441 and is currently estimated at $242,559, approximately $252 per square foot. 1004 Highland Ave Unit 1 is a home located in Will County with nearby schools including Walsh Elementary School, Ludwig Elementary School, and Reed Elementary School.
Ownership History
Date
Name
Owned For
Owner Type
Purchase Details
Closed on
Aug 24, 2004
Sold by
Vanda Peter M
Bought by
Vanda Peter M and Vanda Deborah A
Current Estimated Value
Home Financials for this Owner
Home Financials are based on the most recent Mortgage that was taken out on this home.
Original Mortgage
$117,300
Outstanding Balance
$72,529
Interest Rate
9.95%
Mortgage Type
New Conventional
Estimated Equity
$170,030
Purchase Details
Closed on
Apr 13, 2001
Sold by
Vanda Peter M and Vanda Deborah A
Bought by
Vanda Peter M
Home Financials for this Owner
Home Financials are based on the most recent Mortgage that was taken out on this home.
Original Mortgage
$96,300
Interest Rate
7.03%
Purchase Details
Closed on
May 26, 1994
Sold by
Wood Jimmy Lee and Wood Grace O
Bought by
Vanda Peter M and Vanda Deborah A
Home Financials for this Owner
Home Financials are based on the most recent Mortgage that was taken out on this home.
Original Mortgage
$88,740
Interest Rate
8.48%
Mortgage Type
Assumption
Create a Home Valuation Report for This Property
The Home Valuation Report is an in-depth analysis detailing your home's value as well as a comparison with similar homes in the area
Home Values in the Area
Average Home Value in this Area
Purchase History
| Date | Buyer | Sale Price | Title Company |
|---|---|---|---|
| Vanda Peter M | -- | Residential Title Services | |
| Vanda Peter M | -- | Oconnor Title Services Inc | |
| Vanda Peter M | $87,000 | -- |
Source: Public Records
Mortgage History
| Date | Status | Borrower | Loan Amount |
|---|---|---|---|
| Open | Vanda Peter M | $117,300 | |
| Closed | Vanda Peter M | $96,300 | |
| Closed | Vanda Peter M | $88,740 |
Source: Public Records
Tax History Compared to Growth
Tax History
| Year | Tax Paid | Tax Assessment Tax Assessment Total Assessment is a certain percentage of the fair market value that is determined by local assessors to be the total taxable value of land and additions on the property. | Land | Improvement |
|---|---|---|---|---|
| 2024 | $4,121 | $69,578 | $26,197 | $43,381 |
| 2023 | $4,121 | $62,463 | $23,518 | $38,945 |
| 2022 | $3,827 | $58,265 | $21,937 | $36,328 |
| 2021 | $2,947 | $54,756 | $20,616 | $34,140 |
| 2020 | $2,973 | $52,955 | $19,938 | $33,017 |
| 2019 | $2,966 | $50,195 | $18,899 | $31,296 |
| 2018 | $3,678 | $50,113 | $17,821 | $32,292 |
| 2017 | $3,490 | $47,307 | $16,823 | $30,484 |
| 2016 | $3,288 | $44,337 | $15,767 | $28,570 |
| 2015 | $2,741 | $39,061 | $13,891 | $25,170 |
| 2014 | $2,741 | $36,168 | $12,862 | $23,306 |
| 2013 | $2,741 | $36,906 | $13,124 | $23,782 |
Source: Public Records
Map
Nearby Homes
- 1022 Highland Ave
- 1108 E 9th St
- 308 Macgregor Rd
- 936 Treeline Ct Unit 5B
- 605 Gloria St
- 613 E 3rd St
- 134 S Jefferson St
- 540 E 4th St
- 701 E 7th St
- 510 N Lockwood Dr
- 9.5 Acres S Archer Ave
- 219 S Washington St
- 118 N State St
- 120 N State St
- 0 151st & MacGregor St Unit MRD11873272
- 0 Smith Rd South of 135th St Unit MRD12274096
- 0 N State St Unit 10995892
- 818 E 11th St
- 814 S Washington St
- 1212 Grandview Ave
- 1002 Highland Ave
- 203 Macintyre St
- 205 Macintyre St
- 202 Macintyre St Unit 1
- 1000 Highland Ave
- 204 Mccameron Ave
- 1005 Highland Ave
- 204 Macintyre St
- 1003 Highland Ave
- 206 Mccameron Ave Unit 1
- 207 Macintyre St
- 206 Macintyre St
- 106 Mccameron Ave
- 1012 Highland Ave
- 1011 Highland Ave
- 208 Mccameron Ave
- 301 Macintyre St
- 302 Stuart Rd
- 104 Mccameron Ave