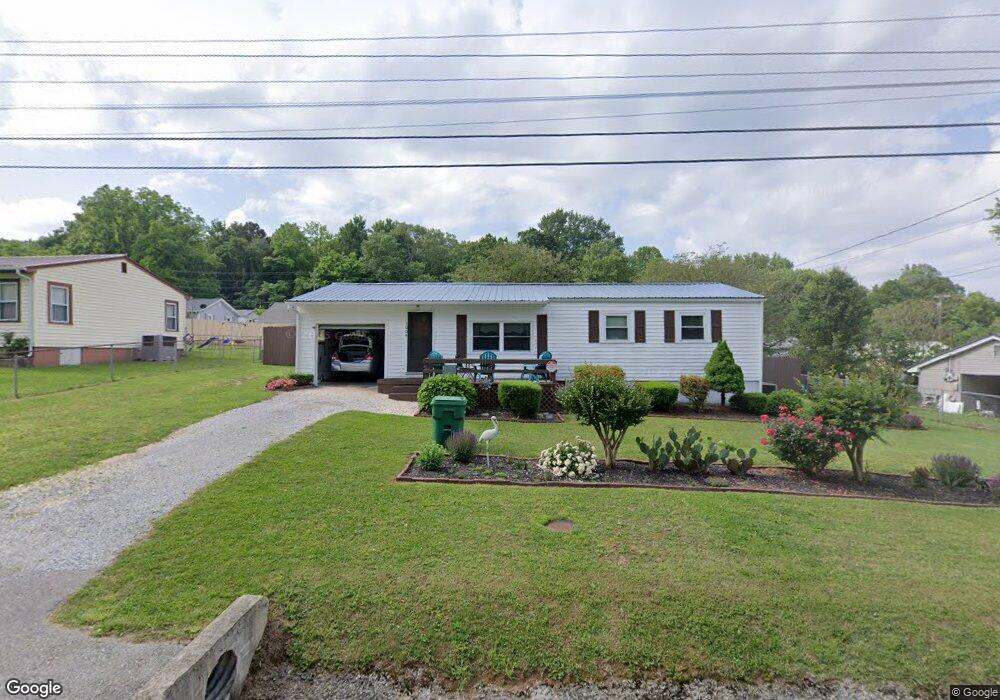
1004 Marsh Ave Morristown, TN 37814
Estimated Value: $170,000 - $174,849
--
Bed
1
Bath
912
Sq Ft
$189/Sq Ft
Est. Value
About This Home
This home is located at 1004 Marsh Ave, Morristown, TN 37814 and is currently estimated at $172,712, approximately $189 per square foot. 1004 Marsh Ave is a home located in Hamblen County with nearby schools including Fairview-Marguerite Elementary School, Meadowview Middle School, and Morristown East High School.
Ownership History
Date
Name
Owned For
Owner Type
Purchase Details
Closed on
Oct 10, 2012
Sold by
Us Bank National Associati
Bought by
Pait Charlie and Bottlemy Sherry
Current Estimated Value
Home Financials for this Owner
Home Financials are based on the most recent Mortgage that was taken out on this home.
Original Mortgage
$58,814
Outstanding Balance
$41,089
Interest Rate
3.7%
Mortgage Type
FHA
Estimated Equity
$131,623
Purchase Details
Closed on
Jun 8, 2012
Sold by
Lane Kenneth E
Bought by
Us Bank National Association T and Citigroup Mtg Loan Trust
Purchase Details
Closed on
Oct 25, 2006
Sold by
Wayne Quinton Harold
Bought by
Lane Kenneth E
Home Financials for this Owner
Home Financials are based on the most recent Mortgage that was taken out on this home.
Original Mortgage
$57,840
Interest Rate
8.38%
Purchase Details
Closed on
Feb 17, 2006
Bought by
Walden Lue Velma Norton L and %Wayne Quinton E
Purchase Details
Closed on
Jul 18, 1963
Bought by
Walden Lue Velma Norton
Create a Home Valuation Report for This Property
The Home Valuation Report is an in-depth analysis detailing your home's value as well as a comparison with similar homes in the area
Home Values in the Area
Average Home Value in this Area
Purchase History
| Date | Buyer | Sale Price | Title Company |
|---|---|---|---|
| Pait Charlie | $59,900 | -- | |
| Us Bank National Association T | $44,200 | -- | |
| Lane Kenneth E | $72,300 | -- | |
| Walden Lue Velma Norton L | -- | -- | |
| Walden Lue Velma Norton | -- | -- |
Source: Public Records
Mortgage History
| Date | Status | Borrower | Loan Amount |
|---|---|---|---|
| Open | Pait Charlie | $58,814 | |
| Previous Owner | Walden Lue Velma Norton | $57,840 | |
| Previous Owner | Walden Lue Velma Norton | $14,460 |
Source: Public Records
Tax History Compared to Growth
Tax History
| Year | Tax Paid | Tax Assessment Tax Assessment Total Assessment is a certain percentage of the fair market value that is determined by local assessors to be the total taxable value of land and additions on the property. | Land | Improvement |
|---|---|---|---|---|
| 2024 | $324 | $18,425 | $2,275 | $16,150 |
| 2023 | $324 | $18,425 | $0 | $0 |
| 2022 | $582 | $18,425 | $2,275 | $16,150 |
| 2021 | $582 | $18,425 | $2,275 | $16,150 |
| 2020 | $581 | $18,425 | $2,275 | $16,150 |
| 2019 | $562 | $16,525 | $2,125 | $14,400 |
| 2018 | $521 | $16,525 | $2,125 | $14,400 |
| 2017 | $503 | $16,225 | $2,125 | $14,100 |
| 2016 | $481 | $16,225 | $2,125 | $14,100 |
| 2015 | $447 | $16,225 | $2,125 | $14,100 |
| 2014 | -- | $16,225 | $2,125 | $14,100 |
| 2013 | -- | $17,275 | $0 | $0 |
Source: Public Records
Map
Nearby Homes
- 1420 Buffalo Trail
- 637 Carriger St
- 1215 Shields Ferry Rd
- 000 Devault St
- 1101 Sherwood Dr
- 1449 N Easley Ct
- 1542 Shields Ferry Rd
- 1562 Shields Ferry Rd
- 1324 Davis St
- 1111 Carmichael St
- 2358 Stream View Ln
- 602 Hilltop Dr
- 1323 Goodson Ave
- 311 E 4th St N
- 400 E 4th St N
- 215 E 5th St N
- 1126 E 2nd St N
- 721 E 1st North St
- 721 E 1st St N
- 551 Callaway Dr