Estimated Value: $301,000 - $325,000
3
Beds
2
Baths
1,538
Sq Ft
$203/Sq Ft
Est. Value
About This Home
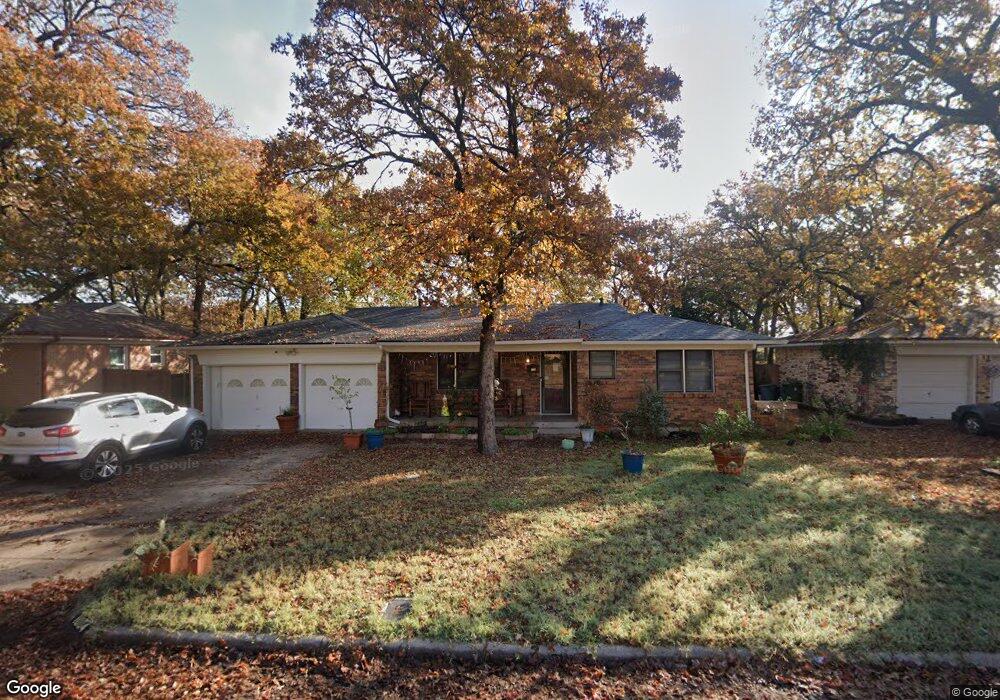
This home is located at 1004 Reed St, Hurst, TX 76053 and is currently estimated at $311,643, approximately $202 per square foot. 1004 Reed St is a home located in Tarrant County with nearby schools including Harrison Lane Elementary School, Hurst J High School, and L.D. Bell High School.
Ownership History
Date
Name
Owned For
Owner Type
Purchase Details
Closed on
May 18, 2001
Sold by
Troub Randall Earl
Bought by
Metz Ladonna Paige
Current Estimated Value
Home Financials for this Owner
Home Financials are based on the most recent Mortgage that was taken out on this home.
Original Mortgage
$92,263
Outstanding Balance
$34,349
Interest Rate
6.99%
Mortgage Type
FHA
Estimated Equity
$277,294
Purchase Details
Closed on
Jul 25, 1996
Sold by
Wallace Homer Edward and Wallace Barbara Ann
Bought by
Troub Lynnette Kay
Home Financials for this Owner
Home Financials are based on the most recent Mortgage that was taken out on this home.
Original Mortgage
$30,000
Interest Rate
8.41%
Mortgage Type
Seller Take Back
Create a Home Valuation Report for This Property
The Home Valuation Report is an in-depth analysis detailing your home's value as well as a comparison with similar homes in the area
Home Values in the Area
Average Home Value in this Area
Purchase History
| Date | Buyer | Sale Price | Title Company |
|---|---|---|---|
| Metz Ladonna Paige | -- | Commonwealth Land Title | |
| Troub Lynnette Kay | -- | Safeco Land Title Co |
Source: Public Records
Mortgage History
| Date | Status | Borrower | Loan Amount |
|---|---|---|---|
| Open | Metz Ladonna Paige | $92,263 | |
| Previous Owner | Troub Lynnette Kay | $30,000 |
Source: Public Records
Tax History Compared to Growth
Tax History
| Year | Tax Paid | Tax Assessment Tax Assessment Total Assessment is a certain percentage of the fair market value that is determined by local assessors to be the total taxable value of land and additions on the property. | Land | Improvement |
|---|---|---|---|---|
| 2025 | $5,555 | $271,979 | $65,000 | $206,979 |
| 2024 | $5,555 | $271,979 | $65,000 | $206,979 |
| 2023 | $5,035 | $251,315 | $40,000 | $211,315 |
| 2022 | $5,324 | $231,225 | $40,000 | $191,225 |
| 2021 | $4,976 | $206,320 | $40,000 | $166,320 |
| 2020 | $4,314 | $179,302 | $40,000 | $139,302 |
| 2019 | $4,195 | $171,418 | $40,000 | $131,418 |
| 2018 | $3,635 | $148,523 | $19,000 | $129,523 |
| 2017 | $3,497 | $138,207 | $19,000 | $119,207 |
| 2016 | $2,974 | $117,514 | $19,000 | $98,514 |
| 2015 | $2,358 | $89,900 | $15,000 | $74,900 |
| 2014 | $2,358 | $89,900 | $15,000 | $74,900 |
Source: Public Records
Map
Nearby Homes