Estimated Value: $195,000 - $202,000
3
Beds
2
Baths
2,238
Sq Ft
$89/Sq Ft
Est. Value
About This Home
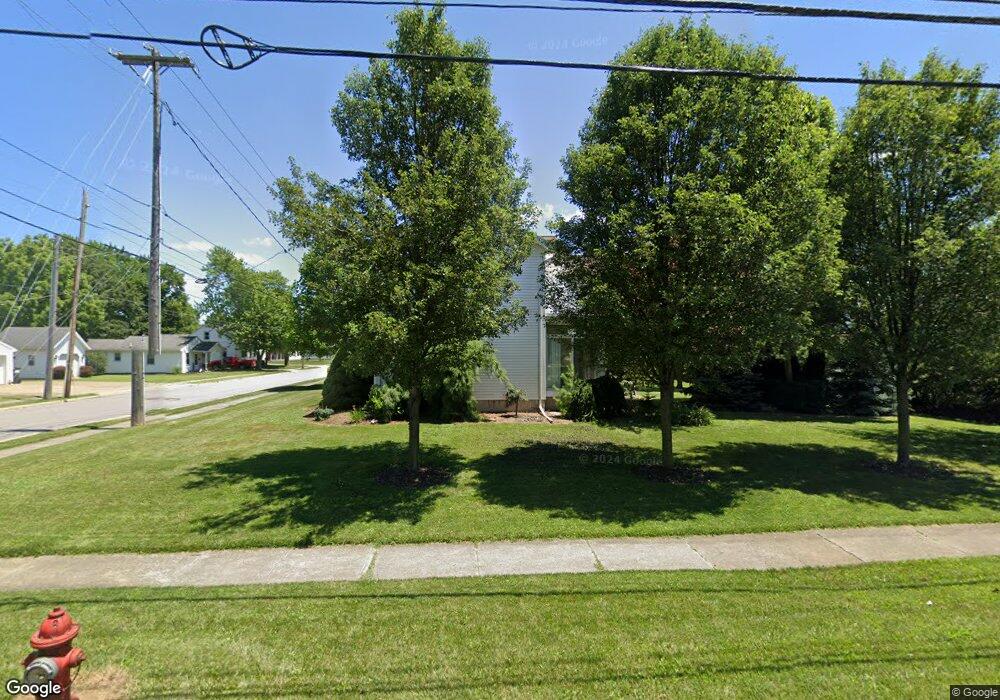
This home is located at 1004 S Main St, Clyde, OH 43410 and is currently estimated at $198,218, approximately $88 per square foot. 1004 S Main St is a home located in Sandusky County with nearby schools including Clyde High School, Harvest Temple Christian Academy, and St Mary's Catholic School.
Ownership History
Date
Name
Owned For
Owner Type
Purchase Details
Closed on
Feb 23, 2016
Sold by
Bilger Jared B and Myers Denielle C
Bought by
Bilger Jared B
Current Estimated Value
Home Financials for this Owner
Home Financials are based on the most recent Mortgage that was taken out on this home.
Original Mortgage
$103,500
Outstanding Balance
$82,077
Interest Rate
3.79%
Mortgage Type
New Conventional
Estimated Equity
$116,141
Purchase Details
Closed on
Mar 11, 2011
Sold by
Baumer Marianne K and Baumer Roger N
Bought by
Bilger Jared B and Myers Denielle C
Home Financials for this Owner
Home Financials are based on the most recent Mortgage that was taken out on this home.
Original Mortgage
$114,034
Interest Rate
5.25%
Mortgage Type
FHA
Purchase Details
Closed on
Mar 21, 1997
Sold by
Baumer Marianne K
Bought by
Baumer Marianne K and Baumer Roger N
Create a Home Valuation Report for This Property
The Home Valuation Report is an in-depth analysis detailing your home's value as well as a comparison with similar homes in the area
Home Values in the Area
Average Home Value in this Area
Purchase History
| Date | Buyer | Sale Price | Title Company |
|---|---|---|---|
| Bilger Jared B | -- | Attorney | |
| Bilger Jared B | $117,000 | First American Title | |
| Baumer Marianne K | $46,000 | -- |
Source: Public Records
Mortgage History
| Date | Status | Borrower | Loan Amount |
|---|---|---|---|
| Open | Bilger Jared B | $103,500 | |
| Closed | Bilger Jared B | $114,034 |
Source: Public Records
Tax History
| Year | Tax Paid | Tax Assessment Tax Assessment Total Assessment is a certain percentage of the fair market value that is determined by local assessors to be the total taxable value of land and additions on the property. | Land | Improvement |
|---|---|---|---|---|
| 2024 | $2,028 | $54,320 | $9,100 | $45,220 |
| 2023 | $1,985 | $44,140 | $7,390 | $36,750 |
| 2022 | $1,755 | $44,140 | $7,390 | $36,750 |
| 2021 | $1,775 | $44,140 | $7,390 | $36,750 |
| 2020 | $1,654 | $39,800 | $7,390 | $32,410 |
| 2019 | $1,634 | $39,800 | $7,390 | $32,410 |
| 2018 | $1,594 | $39,800 | $7,390 | $32,410 |
| 2017 | $1,554 | $36,860 | $7,390 | $29,470 |
| 2016 | $1,530 | $36,860 | $7,390 | $29,470 |
| 2015 | $1,511 | $36,860 | $7,390 | $29,470 |
| 2014 | $1,548 | $36,020 | $7,180 | $28,840 |
| 2013 | $1,511 | $36,020 | $7,180 | $28,840 |
Source: Public Records
Map
Nearby Homes
- 152 Meadow Ln
- 119 Warnecke Dr
- 209 Fair St
- 502 S Main St
- 305 W Cherry St
- 133 W Drew Ln
- 0 Ames St
- 246 Spring St
- 625 Ames St
- 0 W Mcpherson Hwy
- 119 Woodhaven Crescent
- 0 County Road 175
- 155 Nelson St
- 827 W Maple St
- 0 Durnwald Dr
- CR 260 89.6 acres Durnwald Dr
- 0 Merlin Ln Unit 20253762
- 761 N Woodland Ave
- 891 N Woodland Ave
- 1270 W Mcpherson Hwy
- 1010 S Main St
- 926 S Main St
- 126 Lemon St
- 0 S Main Rt 101 Unit 700595
- 0 S Main Rt 101 Unit 700615
- 123 Lemmon St
- 117 Lemon St
- 1014 S Main St
- 123 Lemon St
- 134 Lemon St
- 914 S Main St
- 101 Caleb Dr Unit 101
- 133 Lemon St
- 105 Caleb Dr
- 1015 S Main St
- 904 S Main St
- 109 Caleb Dr Unit 109
- 0 Caleb St
- 134 Bertha Ave
- 143 Lemon St
Your Personal Tour Guide
Ask me questions while you tour the home.