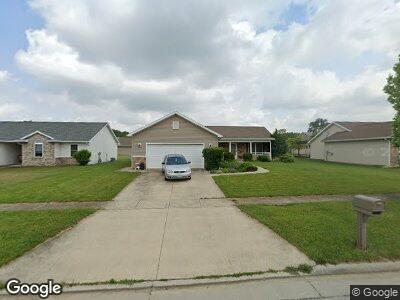
1004 Tomahawk Ln Bowling Green, OH 43402
Estimated Value: $238,000 - $326,000
3
Beds
2
Baths
1,352
Sq Ft
$204/Sq Ft
Est. Value
About This Home
This home is located at 1004 Tomahawk Ln, Bowling Green, OH 43402 and is currently estimated at $275,411, approximately $203 per square foot. 1004 Tomahawk Ln is a home located in Wood County with nearby schools including Bowling Green High School, Montessori School Of Bowling Green, and Bowling Green Christian Academy.
Ownership History
Date
Name
Owned For
Owner Type
Purchase Details
Closed on
Dec 3, 2010
Sold by
Indian Trace Housing Company Llc
Bought by
Miller Judith A
Current Estimated Value
Home Financials for this Owner
Home Financials are based on the most recent Mortgage that was taken out on this home.
Original Mortgage
$53,500
Outstanding Balance
$36,700
Interest Rate
4.22%
Mortgage Type
Purchase Money Mortgage
Purchase Details
Closed on
Sep 12, 2007
Sold by
Indian Ridge Subdivision Llc
Bought by
W S O S Community Action Commission Inc
Home Financials for this Owner
Home Financials are based on the most recent Mortgage that was taken out on this home.
Original Mortgage
$521,400
Interest Rate
6.71%
Mortgage Type
Purchase Money Mortgage
Create a Home Valuation Report for This Property
The Home Valuation Report is an in-depth analysis detailing your home's value as well as a comparison with similar homes in the area
Home Values in the Area
Average Home Value in this Area
Purchase History
| Date | Buyer | Sale Price | Title Company |
|---|---|---|---|
| Miller Judith A | $157,000 | First Capital Title Svcs Inc | |
| Indian Trace Housing Company Llc | -- | First Capital Title Svcs Inc | |
| W S O S Community Action Commission Inc | $215,000 | First Capital Title Svcs Inc |
Source: Public Records
Mortgage History
| Date | Status | Borrower | Loan Amount |
|---|---|---|---|
| Open | Indian Trace Housing Company Llc | $53,500 | |
| Open | Miller Judith A | $100,000 | |
| Previous Owner | W S O S Community Action Commission Inc | $521,400 |
Source: Public Records
Tax History Compared to Growth
Tax History
| Year | Tax Paid | Tax Assessment Tax Assessment Total Assessment is a certain percentage of the fair market value that is determined by local assessors to be the total taxable value of land and additions on the property. | Land | Improvement |
|---|---|---|---|---|
| 2023 | $2,777 | $73,330 | $12,670 | $60,660 |
| 2021 | $2,214 | $59,610 | $10,890 | $48,720 |
| 2020 | $2,223 | $59,610 | $10,890 | $48,720 |
| 2019 | $2,332 | $51,140 | $10,890 | $40,250 |
| 2018 | $2,316 | $51,140 | $10,890 | $40,250 |
| 2017 | $2,295 | $51,140 | $10,890 | $40,250 |
| 2016 | $2,066 | $45,570 | $12,040 | $33,530 |
| 2015 | $2,066 | $45,570 | $12,040 | $33,530 |
| 2014 | $2,133 | $45,570 | $12,040 | $33,530 |
| 2013 | $2,291 | $45,570 | $12,040 | $33,530 |
Source: Public Records
Map
Nearby Homes
- 0 Sand Ridge Rd Unit Lot 5 6095897
- 0 Sand Ridge Rd Unit Lot 4 6095895
- 0 Sand Ridge Rd Unit Lot 1
- 994 Deer Ridge Run
- 1000 Deer Ridge Run
- 924 Pine Valley Dr
- 930 Pine Valley Dr
- 896 Pine Valley Dr
- 616 Pine Valley Dr
- 884 Pine Valley Dr
- 860 Pine Valley Dr
- 854 Pine Valley Dr
- 848 Pine Valley Dr
- 935 Pine Valley Dr
- 521 Erie Ct
- 416 Donbar Dr
- 1551 Gleneagles Dr
- 0 Mitchell Rd S Unit LotWP001
- 410 S Maple St
- 160 Winfield Dr
- 1004 Tomahawk Ln
- 1000 Tomahawk Ln
- 1008 Tomahawk Ln
- 1005 Arrowhead Dr
- 912 Tomahawk Ln
- 1001 Arrowhead Dr
- 1009 Arrowhead Dr
- 1016 Totem Ln
- 1013 Tomahawk Ln
- 1005 Tomahawk Ln
- 1001 Tomahawk Ln
- 911 Arrowhead Dr
- 1042 Totem Ln
- 1038 Totem Ln
- 908 Tomahawk Ln
- 913 Tomahawk Ln
- 1009 Tomahawk Ln
- 907 Arrowhead Dr
- 1008 Arrowhead Dr
- 1046 Totem Ln