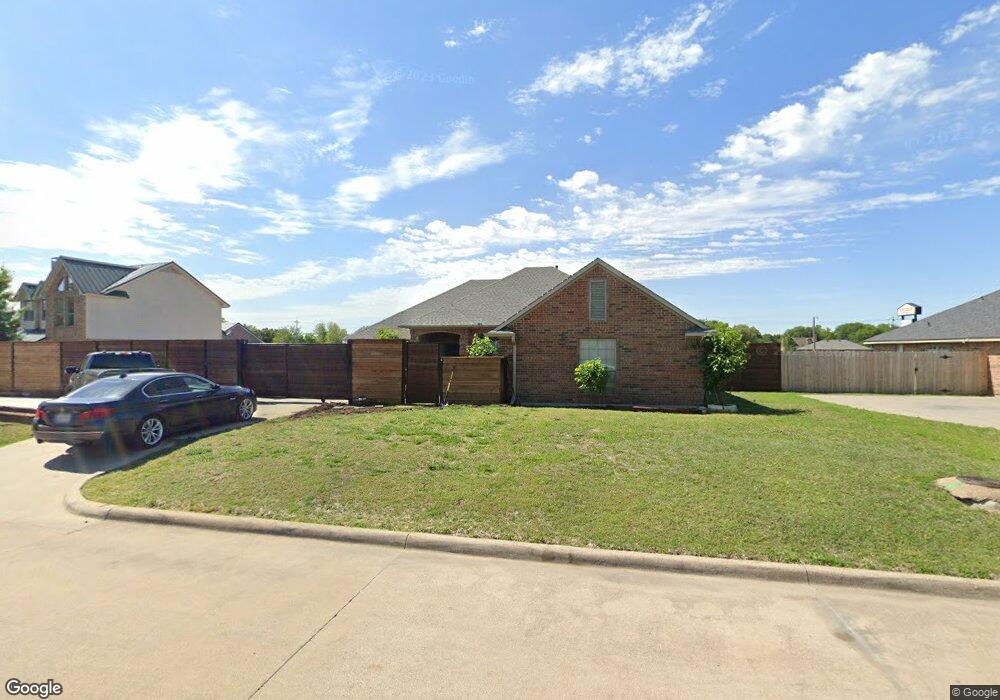
1004 Treys Ct Sanger, TX 76266
Estimated Value: $331,000 - $350,583
3
Beds
2
Baths
1,788
Sq Ft
$189/Sq Ft
Est. Value
About This Home
This home is located at 1004 Treys Ct, Sanger, TX 76266 and is currently estimated at $338,396, approximately $189 per square foot. 1004 Treys Ct is a home located in Denton County with nearby schools including Chisholm Trail Elementary School, Clear Creek Intermediate School, and Sanger Sixth Grade Campus.
Ownership History
Date
Name
Owned For
Owner Type
Purchase Details
Closed on
Aug 11, 2022
Sold by
Earl Holloway
Bought by
Stephens Rachel Cochran
Current Estimated Value
Purchase Details
Closed on
Jul 13, 2022
Sold by
Sherrif Of Denton County
Bought by
Stephens Rachel Cochran
Purchase Details
Closed on
Dec 19, 2011
Sold by
Cochran Michael Andrew and Cochran Ronalee
Bought by
Cochran Betty P
Purchase Details
Closed on
Jan 28, 2004
Sold by
Mortgage Electronic Registration Systems
Bought by
Household Finance Corp Iii
Purchase Details
Closed on
Nov 3, 2000
Sold by
C A R L A W Llc
Bought by
Emery James and Emery Shannon
Home Financials for this Owner
Home Financials are based on the most recent Mortgage that was taken out on this home.
Original Mortgage
$123,120
Interest Rate
10.9%
Purchase Details
Closed on
Nov 30, 1916
Sold by
Cochran Betty P
Bought by
Cochran Stephens Rachel
Create a Home Valuation Report for This Property
The Home Valuation Report is an in-depth analysis detailing your home's value as well as a comparison with similar homes in the area
Home Values in the Area
Average Home Value in this Area
Purchase History
| Date | Buyer | Sale Price | Title Company |
|---|---|---|---|
| Stephens Rachel Cochran | -- | None Listed On Document | |
| Stephens Rachel Cochran | $231,000 | None Listed On Document | |
| Cochran Betty P | -- | None Available | |
| Household Finance Corp Iii | -- | -- | |
| Emery James | -- | -- | |
| Cochran Stephens Rachel | -- | None Available |
Source: Public Records
Mortgage History
| Date | Status | Borrower | Loan Amount |
|---|---|---|---|
| Previous Owner | Emery James | $123,120 |
Source: Public Records
Tax History
| Year | Tax Paid | Tax Assessment Tax Assessment Total Assessment is a certain percentage of the fair market value that is determined by local assessors to be the total taxable value of land and additions on the property. | Land | Improvement |
|---|---|---|---|---|
| 2025 | $8,308 | $356,000 | $61,479 | $294,521 |
| 2024 | $8,308 | $411,101 | $61,479 | $349,622 |
| 2023 | $8,833 | $435,836 | $61,479 | $374,357 |
| 2022 | $5,854 | $263,978 | $49,655 | $214,323 |
| 2021 | $4,910 | $233,624 | $35,255 | $198,369 |
| 2020 | $4,036 | $182,389 | $35,255 | $147,134 |
| 2019 | $4,130 | $181,385 | $35,255 | $146,130 |
| 2018 | $3,960 | $172,994 | $35,255 | $137,739 |
| 2017 | $3,894 | $169,300 | $35,255 | $134,045 |
| 2016 | $3,875 | $160,770 | $22,345 | $138,425 |
| 2015 | $3,220 | $159,526 | $22,345 | $137,181 |
| 2013 | -- | $138,025 | $22,345 | $115,680 |
Source: Public Records
Map
Nearby Homes
- 227 Diane Dr
- 1001 Hunters Ct
- 226 Hillcrest St
- 1012 Cowling Rd
- 113 Diane Dr
- Tbd I35
- 2000 S Stemmons St
- 2004 S Stemmons St
- 127 Bluebonnet Dr
- 136 Eider Dr
- 610 S 10th St
- 327 Deer Run Dr
- 141 Ringneck Dr
- 307 Quail Crossing Dr
- 124 Morning Glory
- TBD Church St
- Tbd Church St
- 1804 Sand Stone Dr
- 188 Aster Dr
- 701 Keaton Rd S Unit S
- 1002 Treys Ct
- 1006 Treys Ct
- 1008 Treys Ct
- 1001 Treys Ct
- 904 S 5th St
- 1005 Treys Ct
- 1007 Treys Ct
- 1010 Treys Ct
- 1002 Hunters Ct
- 1004 Hunters Ct
- 299 Freese Dr Unit 301
- 299 Freese Dr
- 221 Diane Dr
- 225 Diane Dr
- 219 Diane Dr
- 201 Southland Dr
- 111 Southland Dr Unit A
- 203 Southland Dr
- 109 Southland Dr
- 205 Southland Dr
Your Personal Tour Guide
Ask me questions while you tour the home.