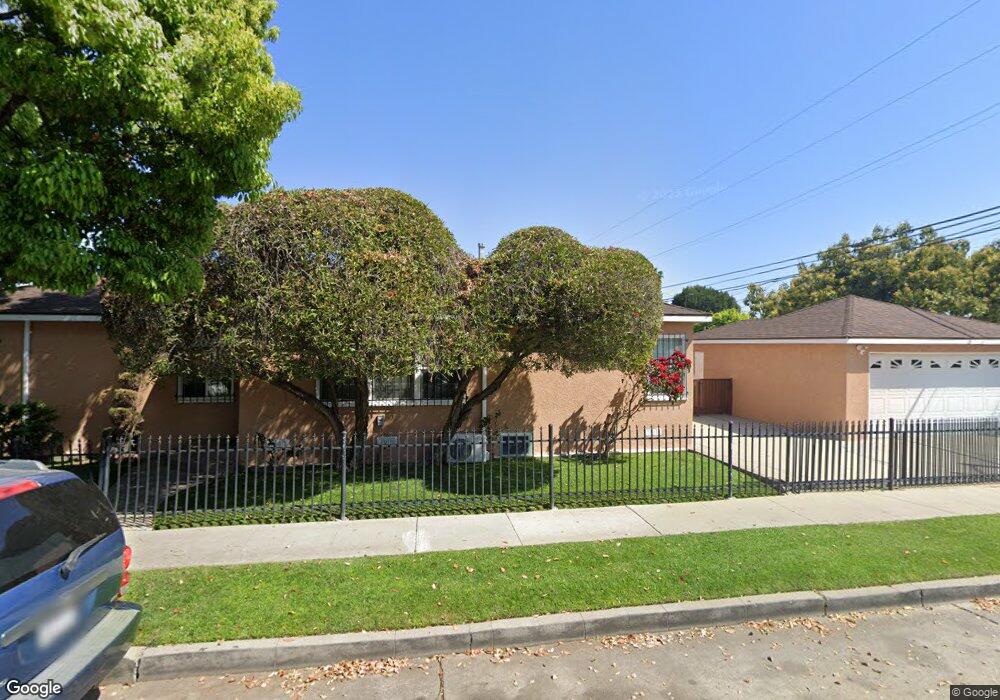
10040 Stanford Ave South Gate, CA 90280
Estimated Value: $674,702 - $755,000
4
Beds
2
Baths
1,597
Sq Ft
$458/Sq Ft
Est. Value
About This Home
This home is located at 10040 Stanford Ave, South Gate, CA 90280 and is currently estimated at $730,676, approximately $457 per square foot. 10040 Stanford Ave is a home located in Los Angeles County with nearby schools including Montara Avenue Elementary School, Southeast Middle School, and South Gate Middle School.
Ownership History
Date
Name
Owned For
Owner Type
Purchase Details
Closed on
Feb 24, 2011
Sold by
Martinez Jose Cadena and Garcia Cecilia
Bought by
Martinez Jose Cadena and Garcia Cecilia
Current Estimated Value
Home Financials for this Owner
Home Financials are based on the most recent Mortgage that was taken out on this home.
Original Mortgage
$222,200
Outstanding Balance
$148,732
Interest Rate
4.25%
Mortgage Type
FHA
Estimated Equity
$581,944
Purchase Details
Closed on
Sep 10, 2002
Sold by
Rivera Angel and Sanchez Maria Dejesus
Bought by
Cadena Jose R
Home Financials for this Owner
Home Financials are based on the most recent Mortgage that was taken out on this home.
Original Mortgage
$192,000
Interest Rate
6.24%
Purchase Details
Closed on
May 10, 1993
Sold by
Camacho Miguel
Bought by
Rivera Angel and Cadena Jose R
Home Financials for this Owner
Home Financials are based on the most recent Mortgage that was taken out on this home.
Original Mortgage
$173,000
Interest Rate
6.88%
Create a Home Valuation Report for This Property
The Home Valuation Report is an in-depth analysis detailing your home's value as well as a comparison with similar homes in the area
Home Values in the Area
Average Home Value in this Area
Purchase History
| Date | Buyer | Sale Price | Title Company |
|---|---|---|---|
| Martinez Jose Cadena | -- | Lawyers Title | |
| Cadena Jose R | $30,000 | Chicago Title Co | |
| Rivera Angel | -- | Fidelity National Title Ins |
Source: Public Records
Mortgage History
| Date | Status | Borrower | Loan Amount |
|---|---|---|---|
| Open | Martinez Jose Cadena | $222,200 | |
| Closed | Cadena Jose R | $192,000 | |
| Previous Owner | Rivera Angel | $173,000 |
Source: Public Records
Tax History Compared to Growth
Tax History
| Year | Tax Paid | Tax Assessment Tax Assessment Total Assessment is a certain percentage of the fair market value that is determined by local assessors to be the total taxable value of land and additions on the property. | Land | Improvement |
|---|---|---|---|---|
| 2025 | $4,463 | $330,704 | $161,199 | $169,505 |
| 2024 | $4,463 | $324,221 | $158,039 | $166,182 |
| 2023 | $4,387 | $317,865 | $154,941 | $162,924 |
| 2022 | $4,184 | $311,633 | $151,903 | $159,730 |
| 2021 | $4,129 | $305,524 | $148,925 | $156,599 |
| 2019 | $3,999 | $296,463 | $144,508 | $151,955 |
| 2018 | $3,897 | $290,651 | $141,675 | $148,976 |
| 2016 | $3,714 | $279,367 | $136,175 | $143,192 |
| 2015 | $3,654 | $275,172 | $134,130 | $141,042 |
| 2014 | $3,657 | $269,783 | $131,503 | $138,280 |
Source: Public Records
Map
Nearby Homes
- 10031 San Anselmo Ave
- 3034 Nebraska Ave
- 2914 Missouri Ave
- 2927 Missouri Ave
- 2600 Nebraska Ave
- 2905 Kansas Ave
- 9616 Long Beach Blvd
- 10303 Long Beach Blvd
- 9612 Long Beach Blvd
- 3130 Kansas Ave
- 10430 San Jose Ave
- 10355 Long Beach Blvd
- 3175 Ohio Ave
- 9320 Long Beach Blvd
- 3220 Tecumseh Ave
- 9534 Deeble St
- 2714 E 109th St
- 3358 Michigan Ave
- 2500 Illinois Ave
- 10719 Mona Blvd
- 10036 Stanford Ave
- 10028 Stanford Ave
- 10102 Stanford Ave
- 10041 San Anselmo Ave
- 10037 San Anselmo Ave
- 10022 Stanford Ave
- 10108 Stanford Ave
- 10111 San Anselmo Ave
- 10016 Stanford Ave
- 10043 Stanford Ave
- 10025 San Anselmo Ave
- 10037 Stanford Ave
- 10031 Stanford Ave
- 10115 San Anselmo Ave
- 10120 Stanford Ave
- 2826 Wisconsin Ave Unit A
- 2826 Wisconsin Ave
- 10015 San Anselmo Ave
- 10010 Stanford Ave
- 10025 Stanford Ave