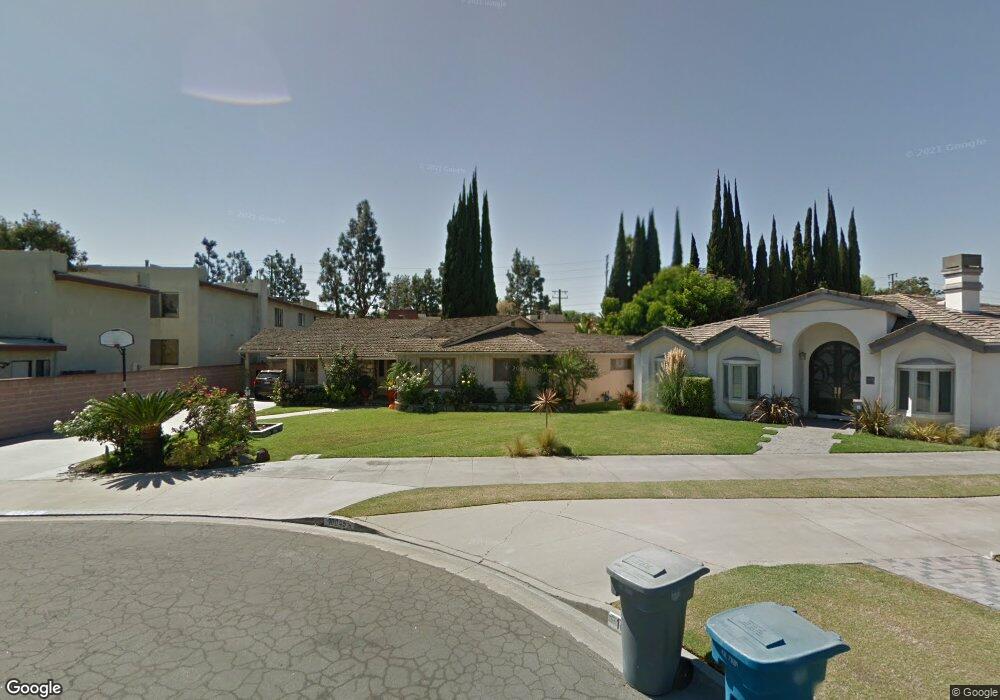
10049 Chaney Ave Downey, CA 90240
Estimated Value: $1,319,000 - $1,644,000
3
Beds
3
Baths
2,427
Sq Ft
$585/Sq Ft
Est. Value
About This Home
This home is located at 10049 Chaney Ave, Downey, CA 90240 and is currently estimated at $1,418,961, approximately $584 per square foot. 10049 Chaney Ave is a home located in Los Angeles County with nearby schools including Rio San Gabriel Elementary School, Doty Middle School, and Downey High School.
Ownership History
Date
Name
Owned For
Owner Type
Purchase Details
Closed on
Feb 24, 2025
Sold by
Jimenez Refugio De Anda and De Anda Jose
Bought by
Jose R De Anda Family Trust and De Anda
Current Estimated Value
Purchase Details
Closed on
Nov 6, 1998
Sold by
Deanda Jose R
Bought by
Deanda Jose R and Deanda Emelia
Home Financials for this Owner
Home Financials are based on the most recent Mortgage that was taken out on this home.
Original Mortgage
$225,450
Interest Rate
6.54%
Purchase Details
Closed on
Jan 12, 1995
Sold by
Burk Martha Jo
Bought by
Deanda Jose R and Deanda Luis
Home Financials for this Owner
Home Financials are based on the most recent Mortgage that was taken out on this home.
Original Mortgage
$215,200
Interest Rate
7.87%
Purchase Details
Closed on
Jan 4, 1995
Sold by
Deanda Emelia
Bought by
Deanda Jose R
Home Financials for this Owner
Home Financials are based on the most recent Mortgage that was taken out on this home.
Original Mortgage
$215,200
Interest Rate
7.87%
Create a Home Valuation Report for This Property
The Home Valuation Report is an in-depth analysis detailing your home's value as well as a comparison with similar homes in the area
Purchase History
| Date | Buyer | Sale Price | Title Company |
|---|---|---|---|
| Jose R De Anda Family Trust | -- | None Listed On Document | |
| Deanda Jose R | -- | United Title Company | |
| Deanda Jose R | $269,000 | Investors Title Company | |
| Deanda Jose R | -- | Investors Title Company |
Source: Public Records
Mortgage History
| Date | Status | Borrower | Loan Amount |
|---|---|---|---|
| Previous Owner | Deanda Jose R | $225,450 | |
| Previous Owner | Deanda Jose R | $215,200 |
Source: Public Records
Tax History
| Year | Tax Paid | Tax Assessment Tax Assessment Total Assessment is a certain percentage of the fair market value that is determined by local assessors to be the total taxable value of land and additions on the property. | Land | Improvement |
|---|---|---|---|---|
| 2025 | $6,015 | $451,812 | $263,362 | $188,450 |
| 2024 | $6,015 | $442,954 | $258,199 | $184,755 |
| 2023 | $5,821 | $434,270 | $253,137 | $181,133 |
| 2022 | $5,541 | $425,756 | $248,174 | $177,582 |
| 2021 | $5,415 | $417,408 | $243,308 | $174,100 |
| 2020 | $5,335 | $413,129 | $240,814 | $172,315 |
| 2019 | $5,281 | $405,030 | $236,093 | $168,937 |
| 2018 | $5,005 | $397,089 | $231,464 | $165,625 |
| 2016 | $4,841 | $381,672 | $222,477 | $159,195 |
| 2015 | $4,774 | $375,940 | $219,136 | $156,804 |
| 2014 | $4,517 | $368,577 | $214,844 | $153,733 |
Source: Public Records
Map
Nearby Homes
- 9125 Gainford St
- 10214 Woodruff Ave
- 9363 Dinsdale St
- 9314 Via Amorita
- 9378 Suva St
- 9044 Bigby St
- 9145 Raviller Dr
- 9356 Farm St
- 9069 Gallatin Rd
- 10055 Mattock Ave
- 9287 Muller St
- 0 Florence Ave Unit DW24207080
- 9457 Gotham St
- 8560 Cherokee Dr
- 8604 Whittle Ct
- 9225 Sideview Dr
- 9246 Manzanar Ave
- 7354 Diamond Dr
- 7344 Diamond Dr
- 9017 Arrington Ave
- 9227 Florence Ave
- 9227 Florence Ave Unit 16
- 9227 Florence Ave Unit 24
- 9227 Florence Ave Unit 23
- 9227 Florence Ave Unit 15
- 9227 Florence Ave Unit 10
- 9227 Florence Ave Unit 11
- 9227 Florence Ave Unit 4
- 9227 Florence Ave Unit 3
- 9227 Florence Ave Unit 36
- 9227 Florence Ave Unit 35
- 9227 Florence Ave Unit 34
- 9227 Florence Ave Unit 33
- 9227 Florence Ave Unit 32
- 9227 Florence Ave Unit 31
- 9227 Florence Ave Unit 30
- 9227 Florence Ave Unit 29
- 9227 Florence Ave Unit 19
- 9227 Florence Ave Unit 18
- 9227 Florence Ave Unit 1
Your Personal Tour Guide
Ask me questions while you tour the home.