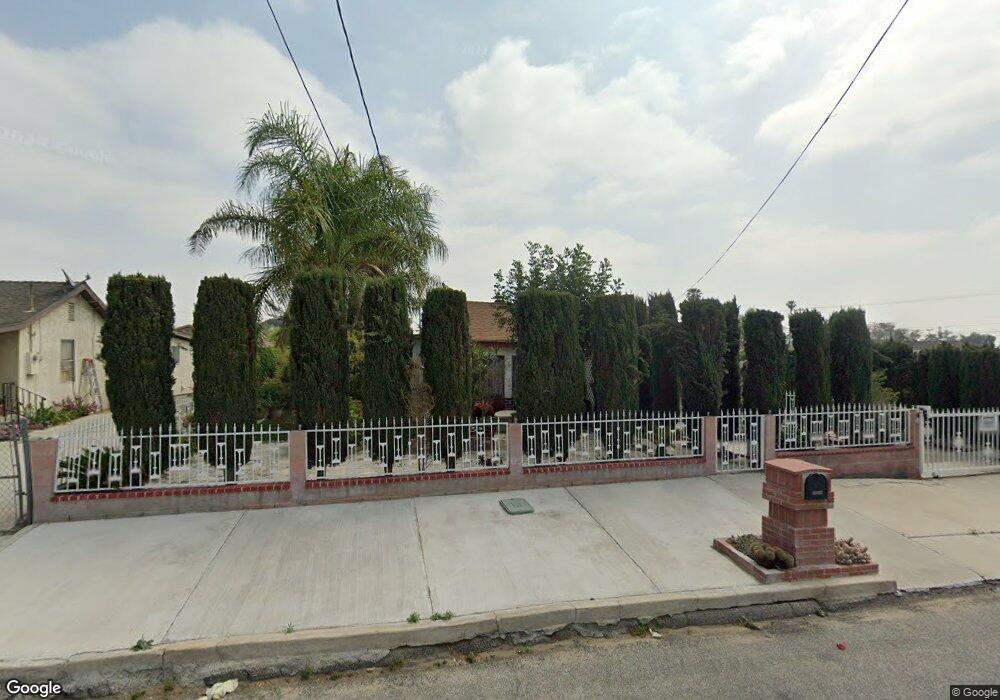
10049 Vine St Bloomington, CA 92316
Estimated Value: $377,781 - $494,000
3
Beds
1
Bath
718
Sq Ft
$618/Sq Ft
Est. Value
About This Home
This home is located at 10049 Vine St, Bloomington, CA 92316 and is currently estimated at $443,445, approximately $617 per square foot. 10049 Vine St is a home located in San Bernardino County with nearby schools including Ruth Grimes Elementary School, Joe Baca, and Colton High School.
Ownership History
Date
Name
Owned For
Owner Type
Purchase Details
Closed on
Jun 30, 2023
Sold by
Carrillo Vitentv and Carrillo Javier Herrera
Bought by
Svc Group Llc
Current Estimated Value
Purchase Details
Closed on
Nov 20, 2020
Sold by
Carrillo Vicente B and Carrillo Raquel
Bought by
Carrillo Vicente and Carrillo Javier Herrera
Home Financials for this Owner
Home Financials are based on the most recent Mortgage that was taken out on this home.
Original Mortgage
$213,750
Interest Rate
2.8%
Mortgage Type
New Conventional
Purchase Details
Closed on
May 29, 2018
Sold by
Carrillo Mareya
Bought by
Carrillo Javier Herrera
Purchase Details
Closed on
May 26, 2018
Sold by
Carrilo Vicente B and Carrilo Raquel
Bought by
Carrilo Vicente B and Carrilo Raquel
Purchase Details
Closed on
May 2, 2018
Sold by
Carrillo Catalina
Bought by
Carrillo Vicente
Create a Home Valuation Report for This Property
The Home Valuation Report is an in-depth analysis detailing your home's value as well as a comparison with similar homes in the area
Home Values in the Area
Average Home Value in this Area
Purchase History
| Date | Buyer | Sale Price | Title Company |
|---|---|---|---|
| Svc Group Llc | -- | Socal Title Company | |
| Carrillo Vicente | -- | Fidelity Natl Ttl Orange Cnt | |
| Carrillo Javier Herrera | -- | Accommodation | |
| Carrilo Vicente B | -- | Advantage Title Inc | |
| Carrillo Vicente | -- | Accommodation |
Source: Public Records
Mortgage History
| Date | Status | Borrower | Loan Amount |
|---|---|---|---|
| Previous Owner | Carrillo Vicente | $213,750 |
Source: Public Records
Tax History
| Year | Tax Paid | Tax Assessment Tax Assessment Total Assessment is a certain percentage of the fair market value that is determined by local assessors to be the total taxable value of land and additions on the property. | Land | Improvement |
|---|---|---|---|---|
| 2025 | $1,428 | $99,574 | $24,894 | $74,680 |
| 2024 | $5,254 | $97,622 | $24,406 | $73,216 |
| 2023 | $1,364 | $95,711 | $23,928 | $71,783 |
| 2022 | $1,342 | $93,834 | $23,459 | $70,375 |
| 2021 | $1,361 | $91,994 | $22,999 | $68,995 |
| 2020 | $1,270 | $91,051 | $22,763 | $68,288 |
| 2019 | $1,238 | $89,266 | $22,317 | $66,949 |
| 2018 | $1,061 | $87,515 | $21,879 | $65,636 |
| 2017 | $1,023 | $85,799 | $21,450 | $64,349 |
| 2016 | $1,047 | $84,116 | $21,029 | $63,087 |
| 2015 | $1,012 | $82,852 | $20,713 | $62,139 |
| 2014 | $970 | $81,229 | $20,307 | $60,922 |
Source: Public Records
Map
Nearby Homes
- 9967 Cedar Ave
- 9847 Cedar Ave
- 9871 Magnolia St
- 9971 Cedar Ave
- 18793 San Bernardino Ave
- 9824 Linden Ave
- 18411 Valley Blvd
- 18411 Valley Blvd Unit 64
- 18411 Valley Blvd Unit 39
- 18411 Valley Blvd Unit 56
- 10573 Larch Ave
- 18325 El Molino St
- 18316 W Hawthorne St
- 0 Argus Township Unit EV22013249
- 778 Bloomington Ave
- 1208 S Fillmore Ave
- 10555 Elm Ave
- 9416 Cedar Ave
- 18605 Sequoia Ave
- 10701 Larch Ave
- 10041 Vine St
- 10035 Vine St
- 10048 Olive St
- 10056 Olive St
- 10040 Olive St
- 10062 Olive St
- 10034 Olive St
- 10068 Olive St
- 10013 Vine St Unit A
- 10026 Olive St
- 18842 Valley Blvd
- 10016 Olive St
- 10047 Olive St
- 10001 Vine St
- 10010 Olive St
- 10055 Olive St
- 10069 Olive St
- 9987 Bloomington Ave
- 10061 Olive St
- 9983 Bloomington Ave
Your Personal Tour Guide
Ask me questions while you tour the home.