1005 39th St Des Moines, IA 50311
Drake NeighborhoodEstimated Value: $227,000 - $255,302
3
Beds
2
Baths
1,189
Sq Ft
$204/Sq Ft
Est. Value
About This Home
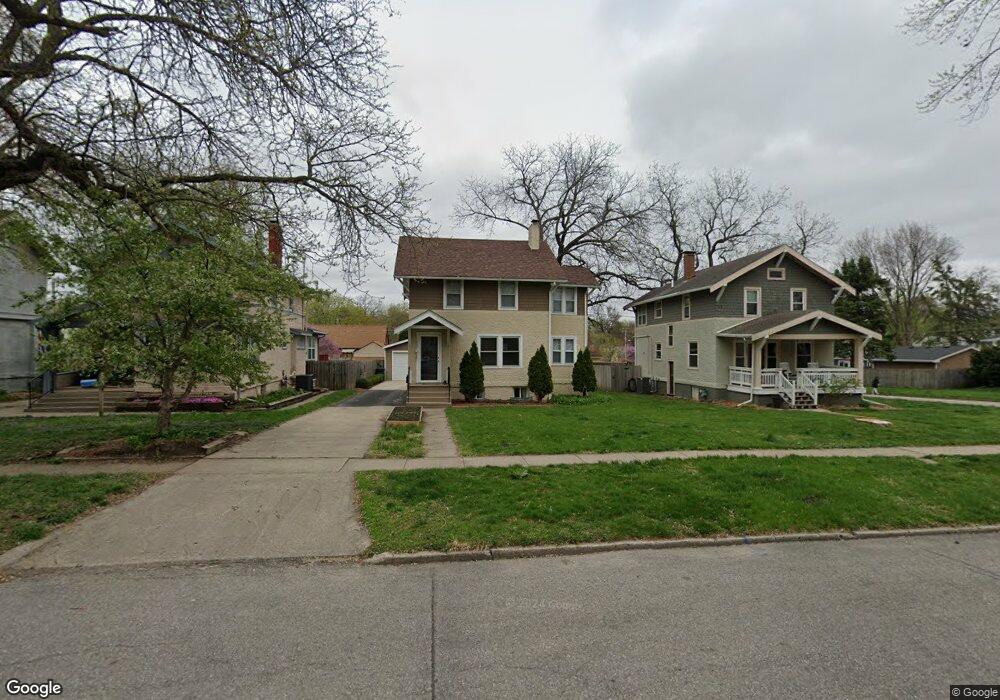
This home is located at 1005 39th St, Des Moines, IA 50311 and is currently estimated at $242,826, approximately $204 per square foot. 1005 39th St is a home located in Polk County with nearby schools including Hubbell Elementary, Roosevelt High School, and St Augustin Catholic School.
Ownership History
Date
Name
Owned For
Owner Type
Purchase Details
Closed on
Jan 28, 2011
Sold by
Foote Gerald R
Bought by
Scott Roger A and Scott Jacqulyn J
Current Estimated Value
Home Financials for this Owner
Home Financials are based on the most recent Mortgage that was taken out on this home.
Original Mortgage
$31,920
Outstanding Balance
$21,876
Interest Rate
4.89%
Mortgage Type
New Conventional
Estimated Equity
$220,950
Purchase Details
Closed on
Apr 6, 1998
Sold by
Hinders Shirley A and Hinders Lonnie L
Bought by
Foote Gerald F
Create a Home Valuation Report for This Property
The Home Valuation Report is an in-depth analysis detailing your home's value as well as a comparison with similar homes in the area
Home Values in the Area
Average Home Value in this Area
Purchase History
| Date | Buyer | Sale Price | Title Company |
|---|---|---|---|
| Scott Roger A | $39,500 | None Available | |
| Foote Gerald F | $29,500 | -- |
Source: Public Records
Mortgage History
| Date | Status | Borrower | Loan Amount |
|---|---|---|---|
| Open | Scott Roger A | $31,920 |
Source: Public Records
Tax History Compared to Growth
Tax History
| Year | Tax Paid | Tax Assessment Tax Assessment Total Assessment is a certain percentage of the fair market value that is determined by local assessors to be the total taxable value of land and additions on the property. | Land | Improvement |
|---|---|---|---|---|
| 2025 | $4,152 | $251,200 | $48,400 | $202,800 |
| 2024 | $4,152 | $228,500 | $43,800 | $184,700 |
| 2023 | $4,326 | $228,500 | $43,800 | $184,700 |
| 2022 | $4,290 | $192,400 | $38,400 | $154,000 |
| 2021 | $4,088 | $192,400 | $38,400 | $154,000 |
| 2020 | $4,242 | $172,400 | $34,600 | $137,800 |
| 2019 | $3,846 | $172,400 | $34,600 | $137,800 |
| 2018 | $3,800 | $151,600 | $30,100 | $121,500 |
| 2017 | $3,520 | $151,600 | $30,100 | $121,500 |
| 2016 | $3,426 | $138,700 | $27,400 | $111,300 |
| 2015 | $3,426 | $138,700 | $27,400 | $111,300 |
| 2014 | $3,244 | $130,800 | $25,700 | $105,100 |
Source: Public Records
Map
Nearby Homes
- 1005 38th St
- 870 39th St
- 1070 37th St
- 4036 Plainview Dr
- 1008 Kingman Cir
- 1001 42nd St
- 4200 Kingman Blvd
- 4000 University Ave Unit 7
- 3406 School St
- 744 37th St
- 3821 University Ave
- 3525 Center St
- 1148 36th St
- 1206 39th St
- 725 40th St
- 1144 35th St
- 4303 Crocker St
- 3908 Pleasant St
- 1242 37th St
- 4012 Pleasant St