1005 3rd St Unit 1 Redding, CA 96002
South Bechelli NeighborhoodEstimated Value: $281,000 - $346,000
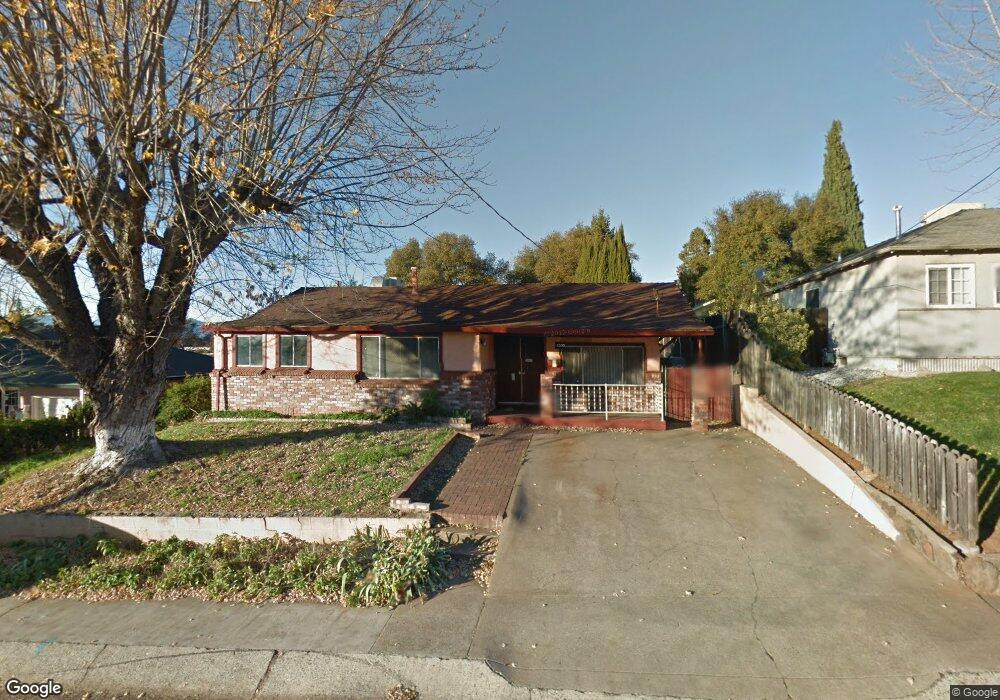
About This Home
This home is located at 1005 3rd St Unit 1, Redding, CA 96002 and is currently estimated at $314,002, approximately $293 per square foot. 1005 3rd St Unit 1 is a home located in Shasta County with nearby schools including Rother Elementary School, Parsons Junior High School, and Enterprise High School.
Ownership History
We collect this data history from publicly available records. To have your information removed, we recommend requesting removal directly through your county’s website.
Purchase Details
Home Financials for this Owner
Home Financials are based on the most recent Mortgage that was taken out on this home.Purchase Details
Purchase Details
Purchase Details
Purchase Details
Home Financials for this Owner
Home Financials are based on the most recent Mortgage that was taken out on this home.Purchase Details
Home Financials for this Owner
Home Financials are based on the most recent Mortgage that was taken out on this home.Home Values in the Area
Average Home Value in this Area
Purchase History
We collect this data history from publicly available records. To have your information removed, we recommend requesting removal directly through your county’s website.
| Date | Buyer | Sale Price | Title Company |
|---|---|---|---|
| $275,000 | Fidelity Natl Ttl Co Of Ca | ||
| $187,500 | Fidelity Natl Title Co Of Ca | ||
| $68,500 | Lsi Title Company | ||
| $95,200 | Accommodation | ||
| $212,000 | Chicago Title Co | ||
| -- | First American Title Co |
Mortgage History
We collect this data history from publicly available records. To have your information removed, we recommend requesting removal directly through your county’s website.
| Date | Status | Borrower | Loan Amount |
|---|---|---|---|
| Open | $261,250 | ||
| Previous Owner | $212,000 | ||
| Previous Owner | $135,000 | ||
| Closed | $135,000 |
Tax History
We collect this data history from publicly available records. To have your information removed, we recommend requesting removal directly through your county’s website.
| Year | Tax Paid | Tax Assessment Tax Assessment Total Assessment is a certain percentage of the fair market value that is determined by local assessors to be the total taxable value of land and additions on the property. | Land | Improvement |
|---|---|---|---|---|
| 2025 | $3,190 | $300,747 | $43,743 | $257,004 |
| 2024 | $3,145 | $294,851 | $42,886 | $251,965 |
| 2023 | $3,145 | $289,071 | $42,046 | $247,025 |
| 2022 | $3,054 | $283,404 | $41,222 | $242,182 |
| 2021 | $2,949 | $277,848 | $40,414 | $237,434 |
| 2020 | $2,232 | $202,954 | $37,884 | $165,070 |
| 2019 | $2,214 | $198,976 | $37,142 | $161,834 |
| 2018 | $2,188 | $195,075 | $36,414 | $158,661 |
| 2017 | $2,227 | $191,250 | $35,700 | $155,550 |
| 2016 | $2,083 | $187,500 | $35,000 | $152,500 |
| 2015 | $821 | $71,587 | $26,126 | $45,461 |
| 2014 | $815 | $70,186 | $25,615 | $44,571 |
Map
Ask me questions while you tour the home.