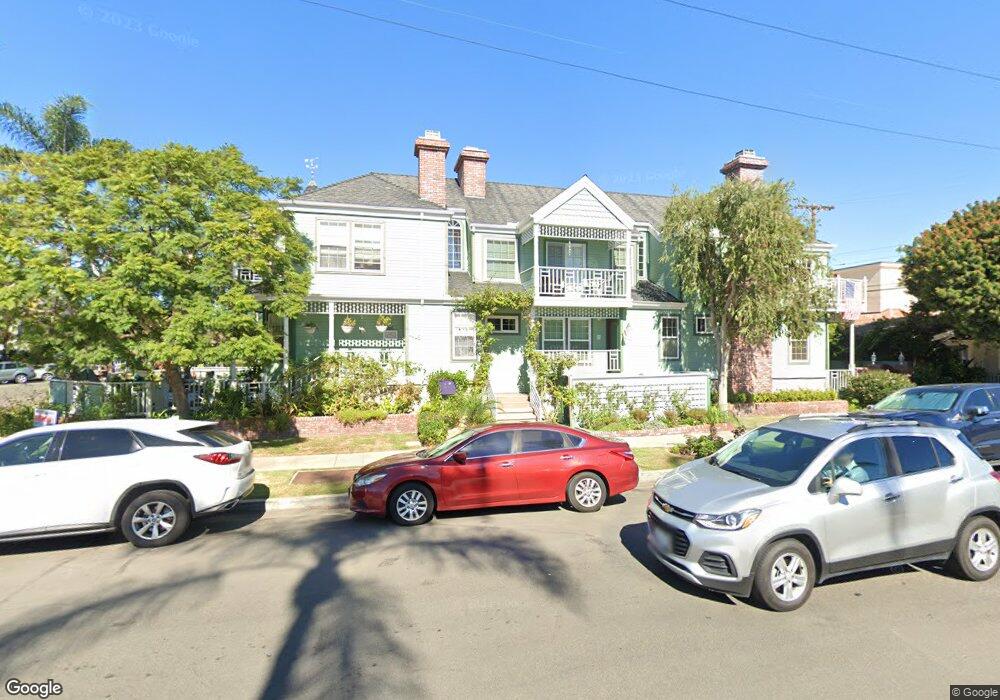
1005 8th St Unit U1 Coronado, CA 92118
Estimated Value: $1,686,000 - $2,109,000
3
Beds
3
Baths
1,756
Sq Ft
$1,089/Sq Ft
Est. Value
About This Home
This home is located at 1005 8th St Unit U1, Coronado, CA 92118 and is currently estimated at $1,912,083, approximately $1,088 per square foot. 1005 8th St Unit U1 is a home located in San Diego County with nearby schools including Coronado Village Elementary, Coronado Middle School, and Coronado High School.
Ownership History
Date
Name
Owned For
Owner Type
Purchase Details
Closed on
Sep 17, 2010
Sold by
Hascup Richard and Hascup Linda K
Bought by
Hascup Richard and Hascup Linda K
Current Estimated Value
Home Financials for this Owner
Home Financials are based on the most recent Mortgage that was taken out on this home.
Original Mortgage
$417,000
Interest Rate
3.86%
Mortgage Type
New Conventional
Purchase Details
Closed on
Jun 7, 2004
Sold by
Hascup Richard and Hascup Linda K
Bought by
Hascup Richard and Hascup Linda K
Purchase Details
Closed on
Sep 9, 1994
Sold by
J & T Development Inc
Bought by
Hascup Richard and Hascup Linda K
Home Financials for this Owner
Home Financials are based on the most recent Mortgage that was taken out on this home.
Original Mortgage
$269,000
Interest Rate
8.57%
Create a Home Valuation Report for This Property
The Home Valuation Report is an in-depth analysis detailing your home's value as well as a comparison with similar homes in the area
Home Values in the Area
Average Home Value in this Area
Purchase History
| Date | Buyer | Sale Price | Title Company |
|---|---|---|---|
| Hascup Richard | -- | First American Title San Die | |
| Hascup Richard | -- | -- | |
| Hascup Richard | $337,000 | California Coast Title |
Source: Public Records
Mortgage History
| Date | Status | Borrower | Loan Amount |
|---|---|---|---|
| Closed | Hascup Richard | $417,000 | |
| Closed | Hascup Richard | $269,000 |
Source: Public Records
Tax History
| Year | Tax Paid | Tax Assessment Tax Assessment Total Assessment is a certain percentage of the fair market value that is determined by local assessors to be the total taxable value of land and additions on the property. | Land | Improvement |
|---|---|---|---|---|
| 2025 | $6,340 | $572,735 | $251,944 | $320,791 |
| 2024 | $6,340 | $561,505 | $247,004 | $314,501 |
| 2023 | $6,242 | $550,496 | $242,161 | $308,335 |
| 2022 | $6,129 | $539,703 | $237,413 | $302,290 |
| 2021 | $6,041 | $529,121 | $232,758 | $296,363 |
| 2020 | $5,881 | $523,697 | $230,372 | $293,325 |
| 2019 | $5,861 | $513,429 | $225,855 | $287,574 |
| 2018 | $5,764 | $503,363 | $221,427 | $281,936 |
| 2017 | $5,643 | $493,494 | $217,086 | $276,408 |
| 2016 | $5,457 | $483,819 | $212,830 | $270,989 |
| 2015 | $5,353 | $476,553 | $209,634 | $266,919 |
| 2014 | $5,206 | $467,219 | $205,528 | $261,691 |
Source: Public Records
Map
Nearby Homes
- 835 D Ave Unit 5
- 835 D Ave Unit 4
- 713 D Ave Unit 19
- 747 Orange Ave Unit 304
- 747 Orange Ave Unit 302
- 747 Orange Ave Unit 303
- 747 Orange Ave Unit 301
- 911 9th St
- 848 E Ave Unit L2
- 855 C Ave
- 861 B Ave
- 1004 10th St
- 811 10th St
- 909 Olive Ave
- 1058 Isabella Ave
- 868 A Ave
- 1054 Isabella Ave Unit 58
- 1056 Isabella Ave
- 535 F Ave Unit 4
- 951-55 B Ave
Your Personal Tour Guide
Ask me questions while you tour the home.