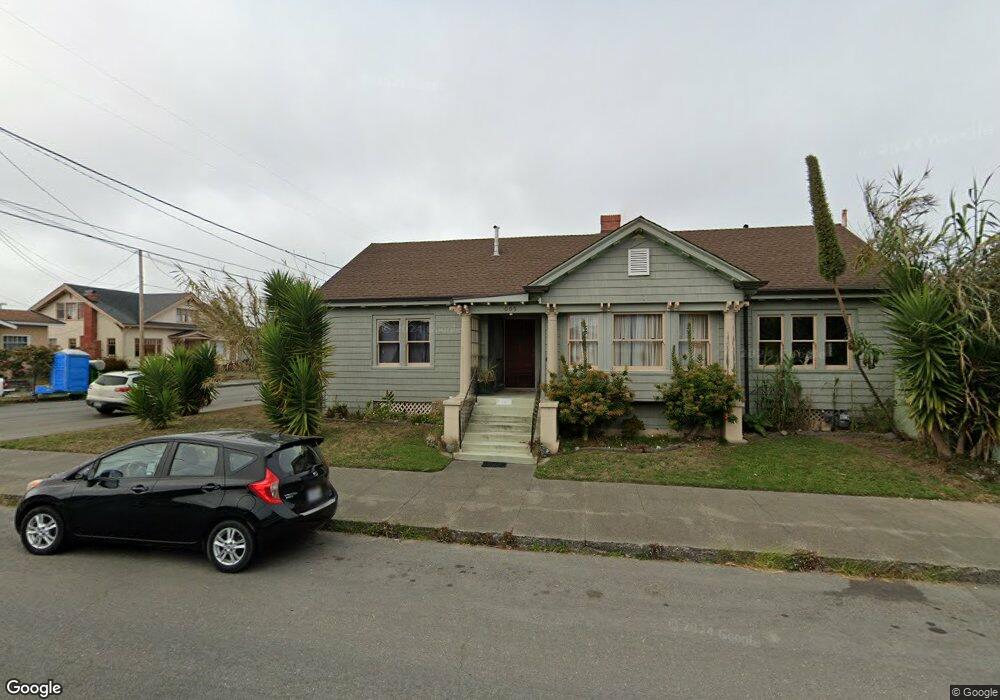
1005 9th St Eureka, CA 95501
City Center NeighborhoodEstimated Value: $339,000 - $435,000
3
Beds
1
Bath
1,506
Sq Ft
$254/Sq Ft
Est. Value
About This Home
This home is located at 1005 9th St, Eureka, CA 95501 and is currently estimated at $382,934, approximately $254 per square foot. 1005 9th St is a home located in Humboldt County with nearby schools including Washington Elementary School, Catherine L. Zane Middle School, and Eureka Senior High School.
Ownership History
Date
Name
Owned For
Owner Type
Purchase Details
Closed on
May 26, 2009
Sold by
Modine Phyllis J and Estate Of John Delbert Hoffie
Bought by
Silver Gary L and Jackson Courtney E
Current Estimated Value
Home Financials for this Owner
Home Financials are based on the most recent Mortgage that was taken out on this home.
Original Mortgage
$203,250
Interest Rate
5.25%
Mortgage Type
FHA
Purchase Details
Closed on
Jun 20, 2006
Sold by
Hoffie John D
Bought by
Hoffie John D
Home Financials for this Owner
Home Financials are based on the most recent Mortgage that was taken out on this home.
Original Mortgage
$394,500
Interest Rate
6.63%
Mortgage Type
FHA
Create a Home Valuation Report for This Property
The Home Valuation Report is an in-depth analysis detailing your home's value as well as a comparison with similar homes in the area
Home Values in the Area
Average Home Value in this Area
Purchase History
| Date | Buyer | Sale Price | Title Company |
|---|---|---|---|
| Silver Gary L | $207,000 | Humboldt Land Title Company | |
| Hoffie John D | -- | First American Title Company |
Source: Public Records
Mortgage History
| Date | Status | Borrower | Loan Amount |
|---|---|---|---|
| Previous Owner | Silver Gary L | $203,250 | |
| Previous Owner | Hoffie John D | $394,500 |
Source: Public Records
Tax History
| Year | Tax Paid | Tax Assessment Tax Assessment Total Assessment is a certain percentage of the fair market value that is determined by local assessors to be the total taxable value of land and additions on the property. | Land | Improvement |
|---|---|---|---|---|
| 2025 | $2,741 | $266,549 | $122,328 | $144,221 |
| 2024 | $2,741 | $261,324 | $119,930 | $141,394 |
| 2023 | $2,703 | $256,201 | $117,579 | $138,622 |
| 2022 | $2,806 | $251,178 | $115,274 | $135,904 |
| 2021 | $2,628 | $246,254 | $113,014 | $133,240 |
| 2020 | $2,608 | $243,730 | $111,856 | $131,874 |
| 2019 | $2,554 | $238,952 | $109,663 | $129,289 |
| 2018 | $2,516 | $234,267 | $107,513 | $126,754 |
| 2017 | $2,603 | $229,674 | $105,405 | $124,269 |
| 2016 | $2,504 | $225,172 | $103,339 | $121,833 |
| 2015 | $2,482 | $221,790 | $101,787 | $120,003 |
| 2014 | $2,320 | $217,447 | $99,794 | $117,653 |
Source: Public Records
Map
Nearby Homes
Your Personal Tour Guide
Ask me questions while you tour the home.