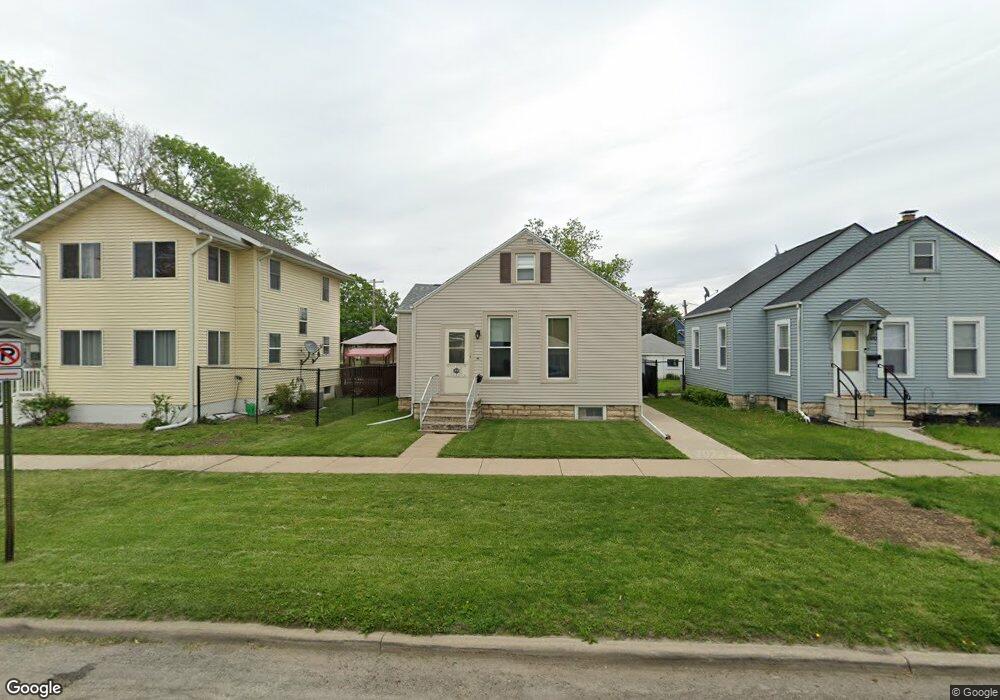
1005 9th St SW Cedar Rapids, IA 52404
Taylor NeighborhoodEstimated Value: $123,000 - $138,000
2
Beds
1
Bath
877
Sq Ft
$148/Sq Ft
Est. Value
About This Home
This home is located at 1005 9th St SW, Cedar Rapids, IA 52404 and is currently estimated at $129,987, approximately $148 per square foot. 1005 9th St SW is a home located in Linn County with nearby schools including Junction City Elementary School, Cedar River Academy at Taylor Elementary School, and Bruce Hall Day Treatment Center.
Ownership History
Date
Name
Owned For
Owner Type
Purchase Details
Closed on
Aug 28, 2014
Sold by
Miller Clinton J
Bought by
Schmidt Mary C
Current Estimated Value
Home Financials for this Owner
Home Financials are based on the most recent Mortgage that was taken out on this home.
Original Mortgage
$8,485
Outstanding Balance
$2,794
Interest Rate
4.11%
Mortgage Type
Stand Alone Second
Estimated Equity
$127,193
Purchase Details
Closed on
Jun 22, 2009
Sold by
Sanborn Michael Ray and Scofield Roxanne Sue
Bought by
Miller Clinton J
Home Financials for this Owner
Home Financials are based on the most recent Mortgage that was taken out on this home.
Original Mortgage
$76,587
Interest Rate
4.92%
Mortgage Type
FHA
Purchase Details
Closed on
Nov 2, 2005
Sold by
Sanborn Floyd A
Bought by
Sanborn Floyd A and Sanborn Michael R
Create a Home Valuation Report for This Property
The Home Valuation Report is an in-depth analysis detailing your home's value as well as a comparison with similar homes in the area
Home Values in the Area
Average Home Value in this Area
Purchase History
| Date | Buyer | Sale Price | Title Company |
|---|---|---|---|
| Schmidt Mary C | $90,000 | None Available | |
| Miller Clinton J | $77,500 | None Available | |
| Sanborn Floyd A | -- | -- |
Source: Public Records
Mortgage History
| Date | Status | Borrower | Loan Amount |
|---|---|---|---|
| Open | Schmidt Mary C | $8,485 | |
| Previous Owner | Miller Clinton J | $76,587 |
Source: Public Records
Tax History Compared to Growth
Tax History
| Year | Tax Paid | Tax Assessment Tax Assessment Total Assessment is a certain percentage of the fair market value that is determined by local assessors to be the total taxable value of land and additions on the property. | Land | Improvement |
|---|---|---|---|---|
| 2025 | $1,906 | $131,300 | $26,300 | $105,000 |
| 2024 | $2,108 | $118,200 | $23,100 | $95,100 |
| 2023 | $2,108 | $118,200 | $23,100 | $95,100 |
| 2022 | $1,852 | $108,800 | $20,000 | $88,800 |
| 2021 | $1,788 | $98,400 | $20,000 | $78,400 |
| 2020 | $1,788 | $89,600 | $16,800 | $72,800 |
| 2019 | $1,692 | $87,000 | $16,800 | $70,200 |
| 2018 | $1,640 | $87,000 | $16,800 | $70,200 |
| 2017 | $1,378 | $71,800 | $16,800 | $55,000 |
| 2016 | $1,750 | $82,300 | $16,800 | $65,500 |
| 2015 | $1,681 | $78,980 | $16,800 | $62,180 |
| 2014 | $1,496 | $79,562 | $16,000 | $63,562 |
| 2013 | $736 | $79,562 | $16,000 | $63,562 |
Source: Public Records
Map
Nearby Homes
- 1005 10th St SW
- 835 10th St SW
- 715 9th Ave SW
- 828 8th Ave SW
- 712 8th St SW
- 702 8th St SW
- 914 6th St SW
- 531 9th St SW
- 531 10th St SW
- 1424 9th St SW
- 919 6th St SW
- 1424 11th St SW
- 815 15th Ave SW
- 452 8th Ave SW
- 1121 15th Ave SW
- 1025 3rd Ave SW
- 411 8th Ave SW
- 523 6th Ave SW
- 657 16th Ave SW
- 810 3rd Ave SW
- 1001 9th St SW
- 1011 9th St SW
- 1015 9th St SW
- 1017 9th St SW
- 822 10th Ave SW
- 1008 8th St SW
- 818 10th Ave SW
- 1019 9th St SW
- 826 10th Ave SW
- 1002 8th St SW
- 1010 8th St SW
- 826 10th Ave SE
- 901 10th Ave SW
- 901 SW 901 10th Ave
- 1012 8th St SW
- 814 10th Ave SW
- 1014 8th St SW
- 917 9th St SW
- 905 10th Ave SW
- 1010 9th St SW