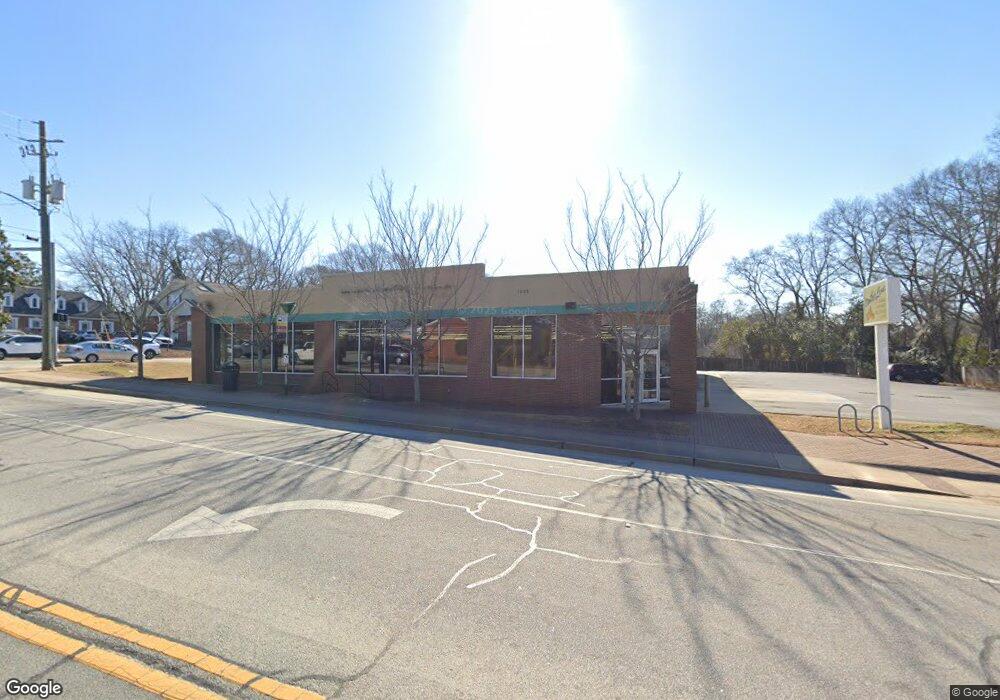
1005 Baxter St Athens, GA 30606
Five Points NeighborhoodEstimated Value: $1,457,363
--
Bed
--
Bath
8,444
Sq Ft
$173/Sq Ft
Est. Value
About This Home
This home is located at 1005 Baxter St, Athens, GA 30606 and is currently estimated at $1,457,363, approximately $172 per square foot. 1005 Baxter St is a home located in Clarke County with nearby schools including Bettye Henderson Holston Elementary School, Clarke Middle School, and Clarke Central High School.
Ownership History
Date
Name
Owned For
Owner Type
Purchase Details
Closed on
Aug 18, 2023
Sold by
Peterson Ray
Bought by
Peterson Christopher R
Current Estimated Value
Purchase Details
Closed on
Apr 10, 2023
Sold by
Aei National Income Property Fund Vii Lp
Bought by
Peterson Ray
Purchase Details
Closed on
Nov 28, 2012
Sold by
Gpi Baxter Llc
Bought by
Aei National Income Property F
Purchase Details
Closed on
Mar 13, 2012
Sold by
Adeduntan Azeez P
Bought by
Gpi Baxter Llc
Purchase Details
Closed on
Dec 28, 2001
Sold by
Robert M Marett Co L P
Bought by
Adeduntan Azeez P
Purchase Details
Closed on
Sep 3, 1993
Sold by
Wier Joel A
Bought by
Robert M Marett Co L P
Purchase Details
Closed on
Mar 14, 1989
Sold by
Wier Joel A and Mary Ellen
Bought by
Wier Joel A
Purchase Details
Closed on
Feb 9, 1989
Sold by
Pae Victor W and Pae Sophia W
Bought by
Wier Joel A and Mary Ellen
Create a Home Valuation Report for This Property
The Home Valuation Report is an in-depth analysis detailing your home's value as well as a comparison with similar homes in the area
Home Values in the Area
Average Home Value in this Area
Purchase History
| Date | Buyer | Sale Price | Title Company |
|---|---|---|---|
| Peterson Christopher R | $1,380,000 | -- | |
| Peterson Ray | $1,300,000 | -- | |
| Aei National Income Property F | $1,800,000 | -- | |
| Gpi Baxter Llc | $450,000 | -- | |
| Adeduntan Azeez P | $350,000 | -- | |
| Robert M Marett Co L P | $175,000 | -- | |
| Wier Joel A | -- | -- | |
| Wier Mary Ellen | -- | -- | |
| Wier Joel A | $344,000 | -- |
Source: Public Records
Tax History Compared to Growth
Tax History
| Year | Tax Paid | Tax Assessment Tax Assessment Total Assessment is a certain percentage of the fair market value that is determined by local assessors to be the total taxable value of land and additions on the property. | Land | Improvement |
|---|---|---|---|---|
| 2025 | $16,146 | $520,000 | $178,343 | $341,657 |
| 2024 | $16,250 | $520,000 | $178,343 | $341,657 |
| 2023 | $16,250 | $520,000 | $178,343 | $341,657 |
| 2022 | $14,432 | $452,405 | $178,343 | $274,062 |
| 2021 | $14,376 | $426,578 | $178,343 | $248,235 |
| 2020 | $14,376 | $426,578 | $178,343 | $248,235 |
| 2019 | $14,482 | $426,578 | $178,343 | $248,235 |
| 2018 | $14,482 | $426,578 | $178,343 | $248,235 |
| 2017 | $14,482 | $426,578 | $178,343 | $248,235 |
| 2016 | $14,482 | $426,578 | $178,342 | $248,235 |
| 2015 | $14,504 | $426,578 | $178,342 | $248,235 |
| 2014 | $14,525 | $426,578 | $178,343 | $248,235 |
Source: Public Records
Map
Nearby Homes
- 338 Springdale St
- 265 Springdale St
- 577 W Cloverhurst Ave
- 597 Dearing St
- 255 Bloomfield St
- 206 Fortson Dr
- 1226 W Broad St
- 224 Fortson Dr
- 997 S Milledge Ave Unit 2
- 997 S Milledge Ave Unit 3
- 997 S Milledge Ave Unit 1
- 997 S Milledge Ave Unit 4
- 1398 W Hancock Ave
- 277 Evans St
- 365 S Church St Unit 1A, 1B, 1C
- 494 Baxter St Unit 32
- 430 S Rocksprings St
- 999 Baxter St
- 440 S Rocksprings St
- 437 S Rocksprings St
- 433 S Rocksprings St
- 470 S Rocksprings St
- 439 S Rocksprings St
- 441 S Rocksprings St
- 443 S Rocksprings St
- 489 S Rocksprings St
- 348 Springdale St
- 447 S Rocksprings St
- 495 S Rocksprings St
- 496 S Rocksprings St
- 402 Springdale St Unit 4
- 406 Springdale St Unit 2
- 402 Springdale St Unit 1
- 406 Springdale St Unit 3
- 400 Springdale St
- 400 Springdale St Unit 1