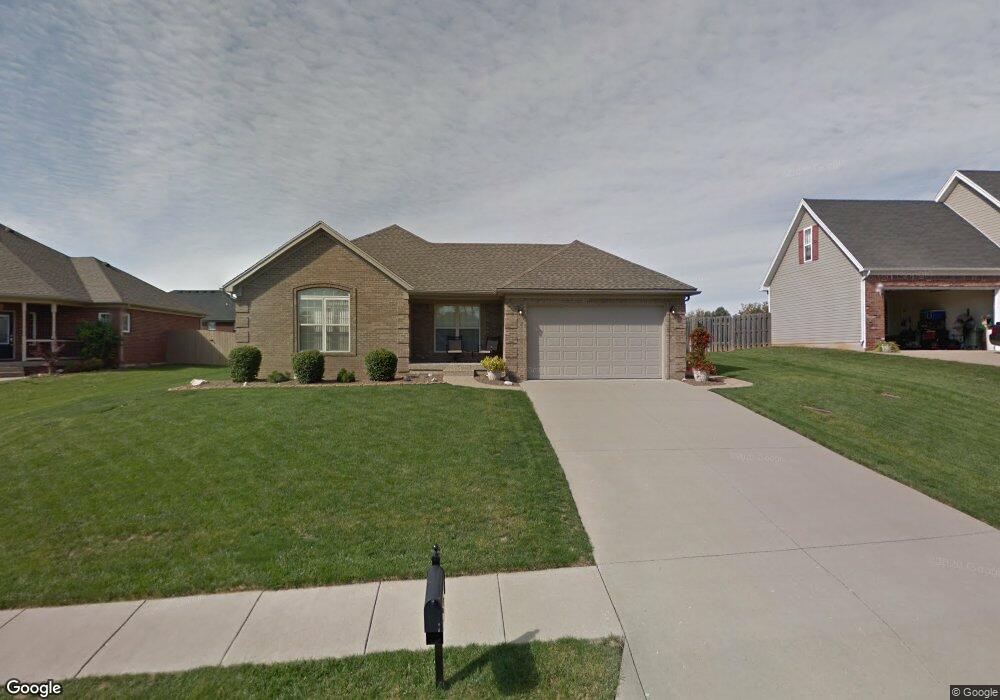
1005 Carter Dr Georgetown, IN 47122
Estimated Value: $297,481 - $385,000
3
Beds
2
Baths
1,475
Sq Ft
$219/Sq Ft
Est. Value
About This Home
This home is located at 1005 Carter Dr, Georgetown, IN 47122 and is currently estimated at $323,120, approximately $219 per square foot. 1005 Carter Dr is a home located in Floyd County with nearby schools including Georgetown Elementary School, Highland Hills Middle School, and Floyd Central High School.
Ownership History
Date
Name
Owned For
Owner Type
Purchase Details
Closed on
Jul 19, 2017
Sold by
Savoy Christopher
Bought by
Campbell Matthew
Current Estimated Value
Home Financials for this Owner
Home Financials are based on the most recent Mortgage that was taken out on this home.
Original Mortgage
$130,000
Outstanding Balance
$106,719
Interest Rate
3.9%
Mortgage Type
New Conventional
Estimated Equity
$216,401
Purchase Details
Closed on
Feb 9, 2006
Sold by
T W H Inc
Bought by
Savoy Christopher and Savoy Kathy
Home Financials for this Owner
Home Financials are based on the most recent Mortgage that was taken out on this home.
Original Mortgage
$35,600
Interest Rate
6.3%
Mortgage Type
Purchase Money Mortgage
Purchase Details
Closed on
Feb 8, 2005
Sold by
Harbison Development Inc
Bought by
T W H Inc
Create a Home Valuation Report for This Property
The Home Valuation Report is an in-depth analysis detailing your home's value as well as a comparison with similar homes in the area
Home Values in the Area
Average Home Value in this Area
Purchase History
| Date | Buyer | Sale Price | Title Company |
|---|---|---|---|
| Campbell Matthew | $180,000 | -- | |
| Campbell Matthew | $180,000 | Title Center Of Indiana | |
| Savoy Christopher | -- | Land Title Group Llc | |
| T W H Inc | -- | None Available |
Source: Public Records
Mortgage History
| Date | Status | Borrower | Loan Amount |
|---|---|---|---|
| Open | Campbell Matthew | $130,000 | |
| Previous Owner | Savoy Christopher | $35,600 |
Source: Public Records
Tax History
| Year | Tax Paid | Tax Assessment Tax Assessment Total Assessment is a certain percentage of the fair market value that is determined by local assessors to be the total taxable value of land and additions on the property. | Land | Improvement |
|---|---|---|---|---|
| 2025 | $2,535 | $289,200 | $41,600 | $247,600 |
| 2024 | $2,494 | $271,800 | $41,600 | $230,200 |
| 2023 | $2,215 | $253,200 | $41,600 | $211,600 |
| 2022 | $2,110 | $229,600 | $41,600 | $188,000 |
| 2021 | $1,906 | $212,100 | $41,600 | $170,500 |
| 2020 | $1,802 | $207,700 | $41,600 | $166,100 |
| 2019 | $1,707 | $203,200 | $41,600 | $161,600 |
| 2018 | $1,577 | $190,300 | $41,600 | $148,700 |
| 2017 | $1,586 | $177,900 | $41,600 | $136,300 |
| 2016 | $1,484 | $177,900 | $41,600 | $136,300 |
| 2014 | $1,702 | $176,000 | $41,600 | $134,400 |
| 2013 | -- | $173,000 | $41,600 | $131,400 |
Source: Public Records
Map
Nearby Homes
- 2013 Mary Ella Dr Unit 229
- 2009 Mary Ella Dr Unit 231
- 2011 Mary Ella Dr Unit 230
- 2008 Mary Ella Dr Unit 232
- 7003 Mitsch Unit Lot 970
- 7001 Mitsch Unit Lot 971
- 7014 Dylan Cir Unit Lot 406
- 8151 - LOT 951 Zelpha Blvd
- 8153 - LOT 952 Zelpha Blvd
- 8145 - LOT 907 Zelpha Blvd
- 8147 - LOT 908 Zelpha Blvd
- 7005 Mitsch Unit Lot 969
- 8164 Zelpha Blvd Unit Lot 932
- 8164- LOT 932 Zelpha Blvd
- 1034 Brookstone Ct
- 1034 Oskin Dr Unit 204
- 2063 Mary Ella Dr
- 8003 Schrieber Rd
- 2022 Brookstone Way
- 5012 Oakhill Ln
- 1003 Carter Dr
- 1007 Carter Dr
- 1004 Woodwinds Ct
- 1002 Woodwinds Ct
- 1009 Carter Dr
- 1006 Woodwinds Ct
- 1136 Copperfield Dr
- 1008 Carter Dr
- 1002 Carter Dr
- 1008 Woodwinds Ct
- 1111 Carter Dr
- 1010 Carter Dr
- 1000 Carter Dr
- 0 Lot 5 Copperfield Dr Unit 200901140
- 0 Lot 6 Copperfield Dr Unit 200901138
- 0 Lot 4 Copperfield Dr Unit 200901137
- 0 Lot 4 5 6 Copperfield Dr Unit 200901139
- 0 Lot 4 5 6 Copperfield Dr Unit 201303867
- 0 Lot 6 Copperfield Dr Unit 201303872
- 0 Lot 5 Copperfield Dr Unit 201303871
Your Personal Tour Guide
Ask me questions while you tour the home.