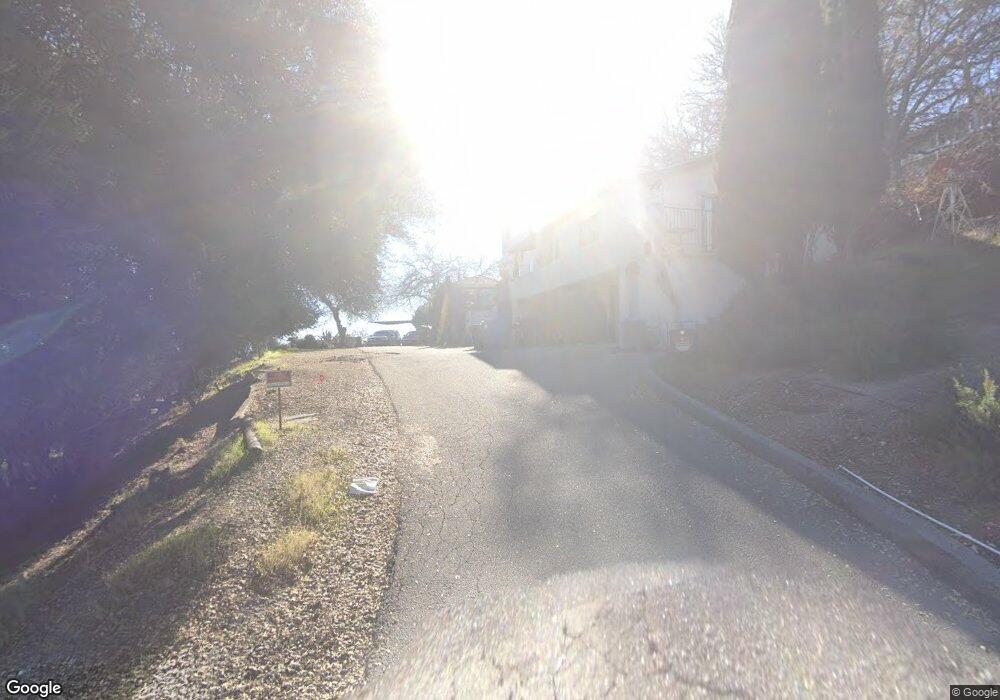
1005 Chestnut St Paso Robles, CA 93446
Estimated Value: $610,000 - $747,000
2
Beds
2
Baths
990
Sq Ft
$704/Sq Ft
Est. Value
About This Home
This home is located at 1005 Chestnut St, Paso Robles, CA 93446 and is currently estimated at $697,280, approximately $704 per square foot. 1005 Chestnut St is a home located in San Luis Obispo County with nearby schools including Glen Speck Elementary School, George H. Flamson Middle School, and Paso Robles High School.
Ownership History
Date
Name
Owned For
Owner Type
Purchase Details
Closed on
Oct 29, 2018
Sold by
Mccoy Sally A
Bought by
Mccoy Stephen L and Mccoy Sally A
Current Estimated Value
Purchase Details
Closed on
Oct 26, 2016
Sold by
Mccoy Sally A and Ballew Jacob A
Bought by
Mccoy Sally A
Purchase Details
Closed on
May 22, 2007
Sold by
Kullgren Frederick C and Kullgren Barbara A
Bought by
Kullgren Barbara E
Purchase Details
Closed on
Jan 30, 2007
Sold by
Kullgren Fred C
Bought by
Kullgren Fred C and Kullgren Barbara
Create a Home Valuation Report for This Property
The Home Valuation Report is an in-depth analysis detailing your home's value as well as a comparison with similar homes in the area
Purchase History
| Date | Buyer | Sale Price | Title Company |
|---|---|---|---|
| Mccoy Stephen L | -- | None Available | |
| Mccoy Sally A | -- | None Available | |
| Kullgren Barbara E | -- | None Available | |
| Kullgren Fred C | -- | None Available |
Source: Public Records
Tax History
| Year | Tax Paid | Tax Assessment Tax Assessment Total Assessment is a certain percentage of the fair market value that is determined by local assessors to be the total taxable value of land and additions on the property. | Land | Improvement |
|---|---|---|---|---|
| 2025 | $375 | $41,522 | $15,660 | $25,862 |
| 2024 | $367 | $40,708 | $15,353 | $25,355 |
| 2023 | $367 | $39,910 | $15,052 | $24,858 |
| 2022 | $360 | $39,128 | $14,757 | $24,371 |
| 2021 | $352 | $38,362 | $14,468 | $23,894 |
| 2020 | $347 | $37,969 | $14,320 | $23,649 |
| 2019 | $340 | $37,226 | $14,040 | $23,186 |
| 2018 | $334 | $36,497 | $13,765 | $22,732 |
| 2017 | $313 | $35,783 | $13,496 | $22,287 |
| 2016 | $305 | $35,082 | $13,232 | $21,850 |
| 2015 | $303 | $34,556 | $13,034 | $21,522 |
| 2014 | $291 | $33,880 | $12,779 | $21,101 |
Source: Public Records
Map
Nearby Homes
Your Personal Tour Guide
Ask me questions while you tour the home.