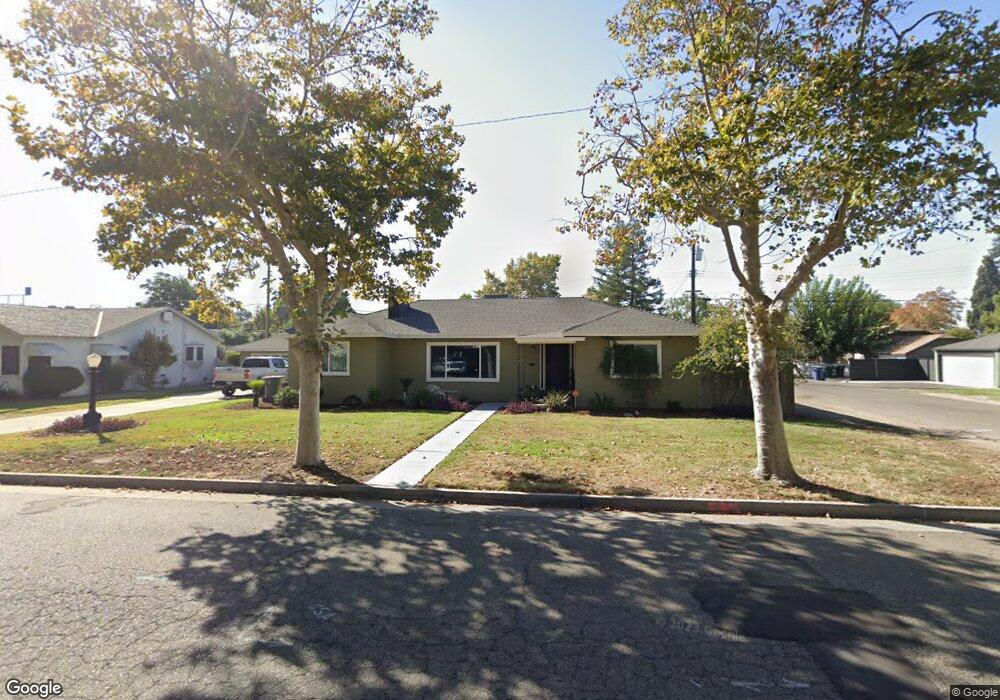
1005 E Sycamore Ave Tulare, CA 93274
Northeast Tulare NeighborhoodEstimated Value: $307,000 - $369,000
3
Beds
2
Baths
1,748
Sq Ft
$193/Sq Ft
Est. Value
About This Home
This home is located at 1005 E Sycamore Ave, Tulare, CA 93274 and is currently estimated at $338,035, approximately $193 per square foot. 1005 E Sycamore Ave is a home located in Tulare County with nearby schools including Wilson Elementary School, Cherry Avenue Middle School, and Tulare Union High School.
Ownership History
Date
Name
Owned For
Owner Type
Purchase Details
Closed on
Feb 27, 2025
Sold by
Doi Kameron and Doi Melinda
Bought by
Kameron Shayne Doi And Melinda Doi Family Tru and Doi
Current Estimated Value
Purchase Details
Closed on
Aug 25, 2010
Sold by
Crow Charles R
Bought by
Doi Kameron and Doi Melinda
Home Financials for this Owner
Home Financials are based on the most recent Mortgage that was taken out on this home.
Original Mortgage
$102,000
Interest Rate
4.51%
Mortgage Type
New Conventional
Purchase Details
Closed on
Mar 10, 2005
Sold by
Clampitt Scott Christopher
Bought by
Crow Charles R and Crow Loretta
Home Financials for this Owner
Home Financials are based on the most recent Mortgage that was taken out on this home.
Original Mortgage
$251,750
Interest Rate
5.37%
Mortgage Type
New Conventional
Purchase Details
Closed on
Nov 18, 2004
Sold by
Clampitt Scott Christopher
Bought by
Clampitt Scott Christopher and York Deborah Elizabeth
Purchase Details
Closed on
Aug 18, 2003
Sold by
York Deborah Elizabeth
Bought by
Clampitt Scott Christopher
Home Financials for this Owner
Home Financials are based on the most recent Mortgage that was taken out on this home.
Original Mortgage
$80,000
Interest Rate
5.87%
Mortgage Type
Purchase Money Mortgage
Purchase Details
Closed on
Aug 9, 2002
Sold by
Clampitt Scott Christopher
Bought by
Clampitt Scott Christopher and York Deborah Elizabeth
Home Financials for this Owner
Home Financials are based on the most recent Mortgage that was taken out on this home.
Original Mortgage
$80,500
Interest Rate
6.86%
Purchase Details
Closed on
Jun 13, 2002
Sold by
Clampitt Deborah York
Bought by
Clampitt Scott Christopher
Home Financials for this Owner
Home Financials are based on the most recent Mortgage that was taken out on this home.
Original Mortgage
$80,500
Interest Rate
6.86%
Purchase Details
Closed on
Mar 23, 1998
Sold by
York Deborah E
Bought by
York Cleo and York Mary Jane
Home Financials for this Owner
Home Financials are based on the most recent Mortgage that was taken out on this home.
Original Mortgage
$117,300
Interest Rate
7.18%
Purchase Details
Closed on
Oct 6, 1994
Sold by
American Mtg Assistance Corp
Bought by
York Deborah E
Home Financials for this Owner
Home Financials are based on the most recent Mortgage that was taken out on this home.
Original Mortgage
$52,900
Interest Rate
8.5%
Mortgage Type
Seller Take Back
Create a Home Valuation Report for This Property
The Home Valuation Report is an in-depth analysis detailing your home's value as well as a comparison with similar homes in the area
Home Values in the Area
Average Home Value in this Area
Purchase History
| Date | Buyer | Sale Price | Title Company |
|---|---|---|---|
| Kameron Shayne Doi And Melinda Doi Family Tru | -- | None Listed On Document | |
| Doi Kameron | $132,000 | Chicago Title Company | |
| Crow Charles R | $265,000 | Stewart Title Of California | |
| Clampitt Scott Christopher | -- | -- | |
| Clampitt Scott Christopher | -- | First American Title Co | |
| Clampitt Scott Christopher | -- | -- | |
| Clampitt Scott Christopher | -- | Chicago Title Co | |
| Clampitt Scott Christopher | $115,000 | Chicago Title Co | |
| York Cleo | $138,000 | Chicago Title Co | |
| York Deborah E | $57,000 | Old Republic Title Co |
Source: Public Records
Mortgage History
| Date | Status | Borrower | Loan Amount |
|---|---|---|---|
| Previous Owner | Doi Kameron | $102,000 | |
| Previous Owner | Crow Charles R | $251,750 | |
| Previous Owner | Clampitt Scott Christopher | $80,000 | |
| Previous Owner | Clampitt Scott Christopher | $80,500 | |
| Previous Owner | York Cleo | $117,300 | |
| Previous Owner | York Deborah E | $52,900 |
Source: Public Records
Tax History
| Year | Tax Paid | Tax Assessment Tax Assessment Total Assessment is a certain percentage of the fair market value that is determined by local assessors to be the total taxable value of land and additions on the property. | Land | Improvement |
|---|---|---|---|---|
| 2025 | $2,036 | $169,113 | $38,433 | $130,680 |
| 2024 | $2,036 | $165,798 | $37,680 | $128,118 |
| 2023 | $1,984 | $162,548 | $36,942 | $125,606 |
| 2022 | $1,926 | $159,362 | $36,218 | $123,144 |
| 2021 | $1,899 | $156,237 | $35,508 | $120,729 |
| 2020 | $1,928 | $154,635 | $35,144 | $119,491 |
| 2019 | $1,972 | $151,603 | $34,455 | $117,148 |
| 2018 | $1,936 | $148,630 | $33,779 | $114,851 |
| 2017 | $1,927 | $145,716 | $33,117 | $112,599 |
| 2016 | $1,850 | $142,859 | $32,468 | $110,391 |
| 2015 | $1,794 | $140,713 | $31,980 | $108,733 |
| 2014 | $1,794 | $137,957 | $31,354 | $106,603 |
Source: Public Records
Map
Nearby Homes
- 1026 E Tulare Ave
- 1072 E Sycamore Ave
- 320 N Blackstone St Unit 14
- 322 N Dayton St
- 1 Spruce St
- 220 S O St
- 0 Spruce St S Unit 239148
- 0 Spruce St S Unit 233400
- 421 S Laspina St
- 1453 E Sonora Ave
- 2838 Hidden Cove
- 1699 E Academy Ave
- 202 N L St
- 736 S Spruce St
- 1150 E Ben Franklin Ave
- 1582 E Ben Franklin Ave
- 876 Cardoza Dr
- 980 S Spruce St
- 576 S Aronian St
- 1019 N Manor Dr
- 1025 E Sycamore Ave
- 1008 E Tulare Ave Unit 1
- 1008 E Tulare Ave
- 1010 E Tulare Ave
- 975 E Sycamore Ave
- 105 N Highland St
- 1008 E Sycamore Ave
- 1022 E Sycamore Ave
- 1035 E Sycamore Ave
- 1032 E Tulare Ave
- 1030 E Sycamore Ave
- 967 E Sycamore Ave
- 970 E Tulare Ave
- 980 E Sycamore Ave
- 1040 E Sycamore Ave
- 1042 E Tulare Ave
- 982 E Sycamore Ave
- 962 E Tulare Ave
- 968 E Sycamore Ave
- 993 E San Joaquin Ave
Your Personal Tour Guide
Ask me questions while you tour the home.