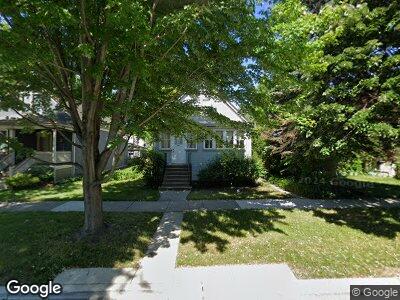
1005 Elgin Ave Forest Park, IL 60130
Estimated Value: $362,000 - $409,000
3
Beds
2
Baths
1,531
Sq Ft
$248/Sq Ft
Est. Value
About This Home
This home is located at 1005 Elgin Ave, Forest Park, IL 60130 and is currently estimated at $378,934, approximately $247 per square foot. 1005 Elgin Ave is a home located in Cook County with nearby schools including Garfield Elementary School, Field Stevenson Elementary School, and Betsy Ross Elementary School.
Ownership History
Date
Name
Owned For
Owner Type
Purchase Details
Closed on
Nov 15, 2001
Sold by
Hillis Jeff Mark and Hillis Janet Marie
Bought by
Liss Holly Anne
Current Estimated Value
Home Financials for this Owner
Home Financials are based on the most recent Mortgage that was taken out on this home.
Original Mortgage
$162,800
Interest Rate
6.6%
Purchase Details
Closed on
Feb 3, 1999
Sold by
Lapoint Jeffrey and Lapoint Julie
Bought by
Hillis Jeff and Hillis Janet
Home Financials for this Owner
Home Financials are based on the most recent Mortgage that was taken out on this home.
Original Mortgage
$154,350
Interest Rate
6.88%
Purchase Details
Closed on
Apr 25, 1994
Sold by
Oconnor Daniel J and Oconnor Marianne
Bought by
Lapoint Jeffrey and Lapoint Julie
Home Financials for this Owner
Home Financials are based on the most recent Mortgage that was taken out on this home.
Original Mortgage
$120,650
Interest Rate
8.08%
Create a Home Valuation Report for This Property
The Home Valuation Report is an in-depth analysis detailing your home's value as well as a comparison with similar homes in the area
Home Values in the Area
Average Home Value in this Area
Purchase History
| Date | Buyer | Sale Price | Title Company |
|---|---|---|---|
| Liss Holly Anne | $203,500 | Lawyers Title Insurance Corp | |
| Hillis Jeff | $171,500 | Prairie Title | |
| Lapoint Jeffrey | $127,000 | -- |
Source: Public Records
Mortgage History
| Date | Status | Borrower | Loan Amount |
|---|---|---|---|
| Open | Liss Holly Anne | $80,000 | |
| Open | Liss Holly Anne | $173,000 | |
| Closed | Liss Holly A | $185,000 | |
| Closed | Liss Holly Anne | $162,800 | |
| Previous Owner | Hillis Jeff | $154,350 | |
| Previous Owner | Lapoint Jeffrey | $120,650 | |
| Closed | Liss Holly Anne | $10,000 |
Source: Public Records
Tax History Compared to Growth
Tax History
| Year | Tax Paid | Tax Assessment Tax Assessment Total Assessment is a certain percentage of the fair market value that is determined by local assessors to be the total taxable value of land and additions on the property. | Land | Improvement |
|---|---|---|---|---|
| 2024 | $7,450 | $31,001 | $4,688 | $26,313 |
| 2023 | $7,450 | $31,001 | $4,688 | $26,313 |
| 2022 | $7,450 | $24,209 | $3,594 | $20,615 |
| 2021 | $7,107 | $24,207 | $3,593 | $20,614 |
| 2020 | $7,002 | $24,207 | $3,593 | $20,614 |
| 2019 | $6,961 | $23,199 | $3,281 | $19,918 |
| 2018 | $6,816 | $23,199 | $3,281 | $19,918 |
| 2017 | $7,441 | $25,437 | $3,281 | $22,156 |
| 2016 | $7,165 | $22,492 | $2,968 | $19,524 |
| 2015 | $7,009 | $22,492 | $2,968 | $19,524 |
| 2014 | $6,895 | $22,492 | $2,968 | $19,524 |
| 2013 | $7,240 | $25,016 | $2,968 | $22,048 |
Source: Public Records
Map
Nearby Homes
- 1001 Elgin Ave
- 1039 Elgin Ave
- 924 Circle Ave
- 1105 Hannah Ave
- 836 Circle Ave
- 1045 Thomas Ave
- 1118 Thomas Ave
- 944 Beloit Ave Unit 2
- 944 Beloit Ave Unit 1
- 944 Beloit Ave Unit 5
- 944 Beloit Ave Unit 4
- 920 Beloit Ave
- 1223 Elgin Ave Unit G1
- 1222 Circle Ave
- 827 Thomas Ave
- 1227 S Harlem Ave Unit 208
- 1227 S Harlem Ave Unit 511
- 1227 S Harlem Ave Unit 512
- 1018 Ferdinand Ave
- 1247 S Harlem Ave Unit 302
- 1005 Elgin Ave
- 1009 Elgin Ave
- 1013 Elgin Ave
- 1015 Elgin Ave
- 1002 Marengo Ave
- 1017 Elgin Ave
- 1010 Marengo Ave
- 1000 Marengo Ave
- 947 Elgin Ave
- 1012 Marengo Ave
- 1014 Marengo Ave
- 1021 Elgin Ave
- 945 Elgin Ave Unit 1
- 945 Elgin Ave Unit 2
- 945 Elgin Ave
- 1016 Marengo Ave
- 1012 Elgin Ave
- 946 Marengo Ave
- 941 Elgin Ave
- 1014 Elgin Ave