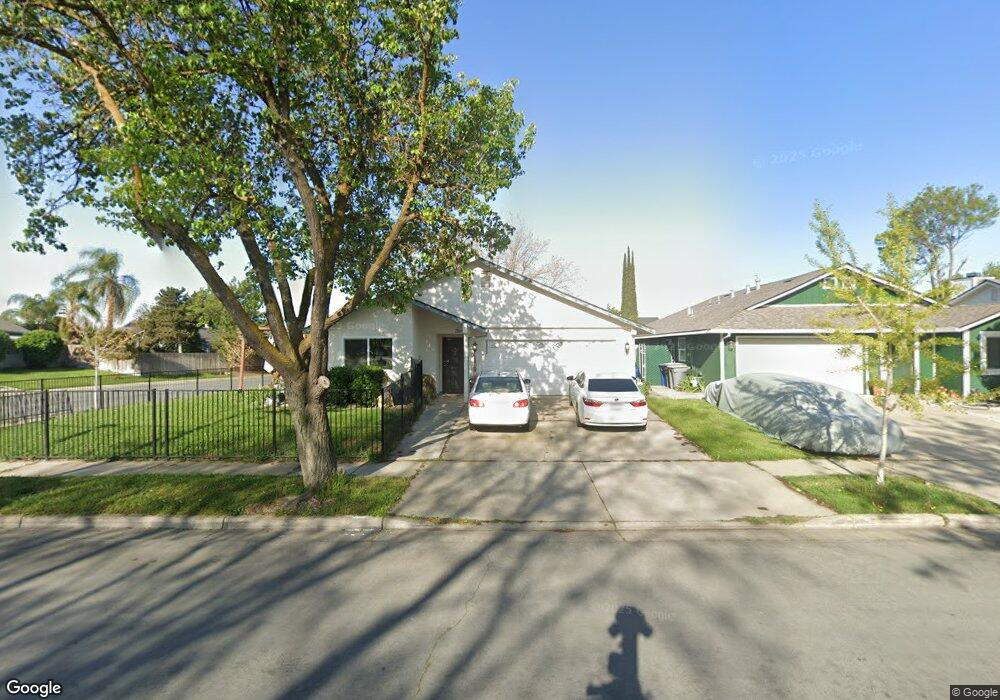
1005 Emory Way Merced, CA 95341
Estimated Value: $298,000 - $378,000
3
Beds
2
Baths
1,368
Sq Ft
$248/Sq Ft
Est. Value
About This Home
This home is located at 1005 Emory Way, Merced, CA 95341 and is currently estimated at $339,901, approximately $248 per square foot. 1005 Emory Way is a home located in Merced County with nearby schools including Leontine Gracey Elementary School, Tenaya Middle School, and El Capitan High School.
Ownership History
Date
Name
Owned For
Owner Type
Purchase Details
Closed on
Jan 30, 2002
Sold by
Townsel Aaron
Bought by
Booth Kellie Patrice
Current Estimated Value
Home Financials for this Owner
Home Financials are based on the most recent Mortgage that was taken out on this home.
Original Mortgage
$118,000
Outstanding Balance
$49,171
Interest Rate
7.17%
Mortgage Type
Purchase Money Mortgage
Estimated Equity
$290,730
Purchase Details
Closed on
Sep 25, 2000
Sold by
Troy Allen and Troy Becky
Bought by
Townsel Aaron and Booth Kellie Patrice
Home Financials for this Owner
Home Financials are based on the most recent Mortgage that was taken out on this home.
Original Mortgage
$85,550
Interest Rate
9.5%
Mortgage Type
Purchase Money Mortgage
Purchase Details
Closed on
May 22, 2000
Sold by
Troy Allen
Bought by
Allen Troy and Duke Becky
Purchase Details
Closed on
Jan 19, 2000
Sold by
Allen Kimberly R
Bought by
Allen Troy
Create a Home Valuation Report for This Property
The Home Valuation Report is an in-depth analysis detailing your home's value as well as a comparison with similar homes in the area
Home Values in the Area
Average Home Value in this Area
Purchase History
| Date | Buyer | Sale Price | Title Company |
|---|---|---|---|
| Booth Kellie Patrice | -- | Fidelity National Title Co | |
| Townsel Aaron | $107,000 | Fidelity National Title Co | |
| Allen Troy | -- | -- | |
| Allen Troy | -- | -- |
Source: Public Records
Mortgage History
| Date | Status | Borrower | Loan Amount |
|---|---|---|---|
| Open | Booth Kellie Patrice | $118,000 | |
| Previous Owner | Townsel Aaron | $85,550 | |
| Closed | Townsel Aaron | $21,450 |
Source: Public Records
Tax History Compared to Growth
Tax History
| Year | Tax Paid | Tax Assessment Tax Assessment Total Assessment is a certain percentage of the fair market value that is determined by local assessors to be the total taxable value of land and additions on the property. | Land | Improvement |
|---|---|---|---|---|
| 2025 | $1,668 | $161,208 | $45,192 | $116,016 |
| 2024 | $1,668 | $158,048 | $44,306 | $113,742 |
| 2023 | $1,644 | $154,950 | $43,438 | $111,512 |
| 2022 | $1,617 | $151,913 | $42,587 | $109,326 |
| 2021 | $1,620 | $148,935 | $41,752 | $107,183 |
| 2020 | $1,629 | $147,408 | $41,324 | $106,084 |
| 2019 | $1,604 | $144,518 | $40,514 | $104,004 |
| 2018 | $1,464 | $141,685 | $39,720 | $101,965 |
| 2017 | $1,492 | $138,908 | $38,942 | $99,966 |
| 2016 | $1,468 | $136,185 | $38,179 | $98,006 |
| 2015 | $1,444 | $134,140 | $37,606 | $96,534 |
| 2014 | $1,194 | $112,000 | $30,000 | $82,000 |
Source: Public Records
Map
Nearby Homes
- 980 Sydney Ln
- 1842 Heritage Dr
- 1941 Rogina Ave
- 1342 Massasso St
- 1803 Lopes Ave
- 836 Beechcraft Ave
- 833 Beechcraft Ave
- 1813 W 7th St
- 1110 V St
- 1413 W 9th St
- 1646 W North Bear Creek Dr
- 1260 T St
- 2500 N State Highway 59
- 2500 N State Highway 59 Unit 36
- 2500 N Highway 59 #115
- 827 R St
- 2440 Crystal Springs Ave
- 2315 W State Highway 140
- 1311 W 1st St
- 118 T St
- 1025 Emory Way
- 1975 Wind Rose Ct
- 1045 Emory Way
- 995 Emory Way
- 1985 Wind Rose Ct
- 1984 Wind Rose Ct
- 1004 Emory Way
- 1976 Patty Dr
- 1946 Patty Dr
- 1024 Emory Way
- 985 Emory Way
- 1986 Patty Dr
- 994 Emory Way
- 1994 Wind Rose Ct
- 1044 Emory Way
- 975 Emory Way
- 2000 Patty Dr
- 2015 Wind Rose Ct
- 992 Alexis Ave
- 984 Emory Way