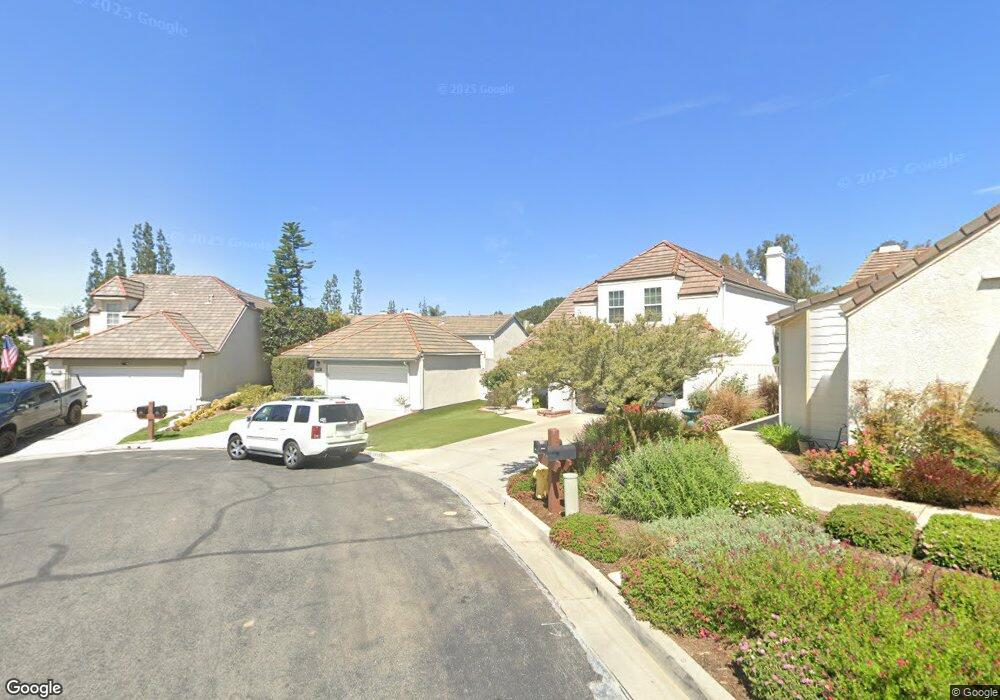
1005 Henrietta Cir Placentia, CA 92870
Estimated Value: $922,696 - $1,139,000
3
Beds
2
Baths
1,322
Sq Ft
$802/Sq Ft
Est. Value
About This Home
This home is located at 1005 Henrietta Cir, Placentia, CA 92870 and is currently estimated at $1,060,674, approximately $802 per square foot. 1005 Henrietta Cir is a home located in Orange County with nearby schools including Morse Avenue Elementary School, Kraemer Middle School, and Valencia High School.
Ownership History
Date
Name
Owned For
Owner Type
Purchase Details
Closed on
Oct 5, 2011
Sold by
Hersey Victoria A
Bought by
Shagan Rita and The Shagan Family Trust
Current Estimated Value
Purchase Details
Closed on
Sep 24, 2001
Sold by
Holmes Thomas and Holmes Karin
Bought by
Hersey Victoria A and Victoria A Hersey Family Trust
Home Financials for this Owner
Home Financials are based on the most recent Mortgage that was taken out on this home.
Original Mortgage
$232,400
Interest Rate
7.32%
Purchase Details
Closed on
Dec 7, 1998
Sold by
Tobler Julie A
Bought by
Holmes Thomas and Holmes Karin
Home Financials for this Owner
Home Financials are based on the most recent Mortgage that was taken out on this home.
Original Mortgage
$165,000
Interest Rate
6.73%
Purchase Details
Closed on
Jan 26, 1998
Sold by
Tobler Julie A
Bought by
Tobler Julie A and The Julie A Tobler Trust
Create a Home Valuation Report for This Property
The Home Valuation Report is an in-depth analysis detailing your home's value as well as a comparison with similar homes in the area
Home Values in the Area
Average Home Value in this Area
Purchase History
| Date | Buyer | Sale Price | Title Company |
|---|---|---|---|
| Shagan Rita | $505,000 | Fidelity National Title | |
| Hersey Victoria A | $332,000 | North American Title Co | |
| Holmes Thomas | $225,000 | Lawyers Title Company | |
| Tobler Julie A | -- | -- |
Source: Public Records
Mortgage History
| Date | Status | Borrower | Loan Amount |
|---|---|---|---|
| Previous Owner | Hersey Victoria A | $232,400 | |
| Previous Owner | Holmes Thomas | $165,000 |
Source: Public Records
Tax History
| Year | Tax Paid | Tax Assessment Tax Assessment Total Assessment is a certain percentage of the fair market value that is determined by local assessors to be the total taxable value of land and additions on the property. | Land | Improvement |
|---|---|---|---|---|
| 2025 | $2,034 | $115,117 | $37,595 | $77,522 |
| 2024 | $2,034 | $112,860 | $36,858 | $76,002 |
| 2023 | $1,962 | $110,648 | $36,136 | $74,512 |
| 2022 | $1,890 | $108,479 | $35,428 | $73,051 |
| 2021 | $1,809 | $106,352 | $34,733 | $71,619 |
| 2020 | $1,812 | $105,262 | $34,377 | $70,885 |
| 2019 | $1,728 | $103,199 | $33,703 | $69,496 |
| 2018 | $1,700 | $101,176 | $33,042 | $68,134 |
| 2017 | $1,668 | $99,193 | $32,394 | $66,799 |
| 2016 | $1,636 | $97,249 | $31,759 | $65,490 |
| 2015 | $1,610 | $95,789 | $31,282 | $64,507 |
| 2014 | $1,572 | $93,913 | $30,669 | $63,244 |
Source: Public Records
Map
Nearby Homes
- 1000 Henrietta Cir
- 1254 Venice Ave
- 1232 Woodside Dr
- 1261 Brian St
- 1126 Naples Ave
- 5142 Hamer Ln
- 1298 Vina Del Mar Ave
- 1280 Dominica Cir
- 937 Finnell Way
- 635 Patten Ave
- 731 Langer Dr
- 1308 Montevideo Ave
- 605 Patten Ave
- 603 Patten Ave
- 585 Patten Ave
- 1418 Avenida de Vaca
- 1355 Montevideo Ave
- 988 Spyglass Place
- 1410 Via Cortez
- 1509 Prospect Ave Unit D
- 1001 Henrietta Cir
- 1000 Powell Dr
- 1230 Eckenrode Way
- 1224 Eckenrode Way
- 1009 Henrietta Cir
- 1236 Eckenrode Way
- 1218 Eckenrode Way
- 1004 Powell Dr
- 1212 Eckenrode Way
- 1242 Eckenrode Way
- 1004 Henrietta Cir
- 1013 Henrietta Cir
- 1206 Eckenrode Way
- 1008 Powell Dr
- 1200 Eckenrode Way
- 1008 Henrietta Cir
- 1017 Henrietta Cir
- 1012 Powell Dr
- 1001 Powell Dr
- 943 Powell Dr
Your Personal Tour Guide
Ask me questions while you tour the home.