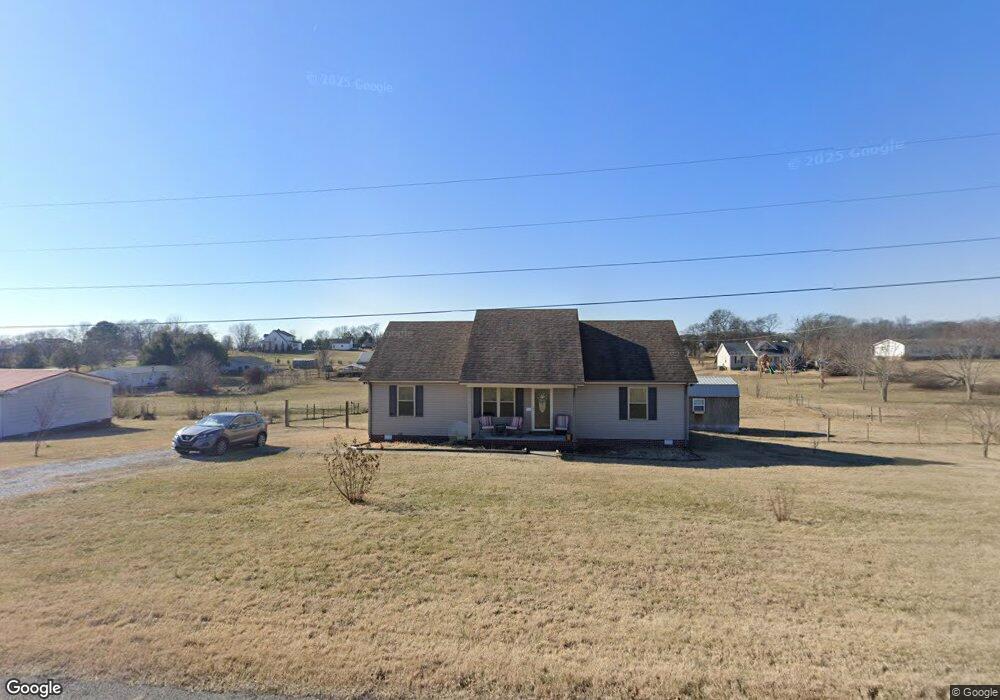
1005 Homer Scott Rd Bethpage, TN 37022
Estimated Value: $323,000 - $350,888
3
Beds
2
Baths
1,400
Sq Ft
$241/Sq Ft
Est. Value
About This Home
This home is located at 1005 Homer Scott Rd, Bethpage, TN 37022 and is currently estimated at $336,972, approximately $240 per square foot. 1005 Homer Scott Rd is a home located in Sumner County with nearby schools including Bethpage Elementary School, Joe Shafer Middle School, and Gallatin Senior High School.
Ownership History
Date
Name
Owned For
Owner Type
Purchase Details
Closed on
Aug 27, 2013
Sold by
Gregory David and Carman Gene
Bought by
Stiltner Beth W
Current Estimated Value
Home Financials for this Owner
Home Financials are based on the most recent Mortgage that was taken out on this home.
Original Mortgage
$117,244
Outstanding Balance
$87,457
Interest Rate
4.39%
Mortgage Type
New Conventional
Estimated Equity
$249,515
Purchase Details
Closed on
Oct 28, 2011
Sold by
Smith Clinton R
Bought by
Gregory David
Purchase Details
Closed on
Jun 28, 2006
Sold by
Smith Dana L
Bought by
Smith Clinton R
Purchase Details
Closed on
Mar 23, 2001
Sold by
Helson Robert C and Hurst Daniel
Bought by
Smith Clinton R and Smith Dana L
Home Financials for this Owner
Home Financials are based on the most recent Mortgage that was taken out on this home.
Original Mortgage
$94,575
Interest Rate
7.02%
Mortgage Type
Construction
Create a Home Valuation Report for This Property
The Home Valuation Report is an in-depth analysis detailing your home's value as well as a comparison with similar homes in the area
Home Values in the Area
Average Home Value in this Area
Purchase History
| Date | Buyer | Sale Price | Title Company |
|---|---|---|---|
| Stiltner Beth W | $114,900 | Benchmark Title Company | |
| Gregory David | $13,000 | None Available | |
| Smith Clinton R | -- | None Available | |
| Smith Clinton R | $19,000 | -- |
Source: Public Records
Mortgage History
| Date | Status | Borrower | Loan Amount |
|---|---|---|---|
| Open | Stiltner Beth W | $117,244 | |
| Previous Owner | Smith Clinton R | $94,575 |
Source: Public Records
Tax History Compared to Growth
Tax History
| Year | Tax Paid | Tax Assessment Tax Assessment Total Assessment is a certain percentage of the fair market value that is determined by local assessors to be the total taxable value of land and additions on the property. | Land | Improvement |
|---|---|---|---|---|
| 2024 | $1,074 | $75,600 | $19,875 | $55,725 |
| 2023 | $1,111 | $49,325 | $6,750 | $42,575 |
| 2022 | $1,116 | $49,325 | $6,750 | $42,575 |
| 2021 | $1,116 | $49,325 | $6,750 | $42,575 |
| 2020 | $1,116 | $49,325 | $6,750 | $42,575 |
| 2019 | $1,116 | $0 | $0 | $0 |
| 2018 | $767 | $0 | $0 | $0 |
| 2017 | $767 | $0 | $0 | $0 |
| 2016 | $767 | $0 | $0 | $0 |
| 2015 | -- | $0 | $0 | $0 |
| 2014 | -- | $0 | $0 | $0 |
Source: Public Records
Map
Nearby Homes
- 1446 Littleton Ranch Rd
- 531 Governor Hall Rd
- 1064 Lauderdale Ln
- 1448 Governor Hall Rd
- 7040 Highway 231 N
- 20 Lauderdale Ln
- 50 Lauderdale Ln
- 1126 Wynnewood Dr
- 0 Highway 231 N Unit RTC3011481
- 0 Highway 231 N Unit RTC3011479
- 0 Highway 231 N Unit RTC2995124
- 777 Rock Springs Rd
- 3588 Hartsville Pike
- 485C Canoe Branch Rd
- 533 Suzanne Way
- 65 Misty Ln
- 2716 Hartsville Pike
- 1114 Hwy 25 W S
- 775 Rock Springs Rd
- 1038 Old Hopewell Rd
- 1009 Homer Scott Rd
- 561 Governor Hall Rd
- 1447 Littleton Ranch Rd
- 1013 Homer Scott Rd
- 571 Governor Hall Rd
- 1448 Littleton Ranch Rd
- 585 Governor Hall Rd
- 1023 Homer Scott Rd
- 593 Governor Hall Rd
- 1029 Homer Scott Rd
- 582 Governor Hall Rd
- 1445 Littleton Ranch Rd
- 1442 Littleton Ranch Rd
- 599 Governor Hall Rd
- 1037 Homer Scott Rd
- 1033 Homer Scott Rd
- 710 Governor Hall Rd
- 722 Governor Hall Rd
- 716D Governor Hall Rd
- 1041 Homer Scott Rd