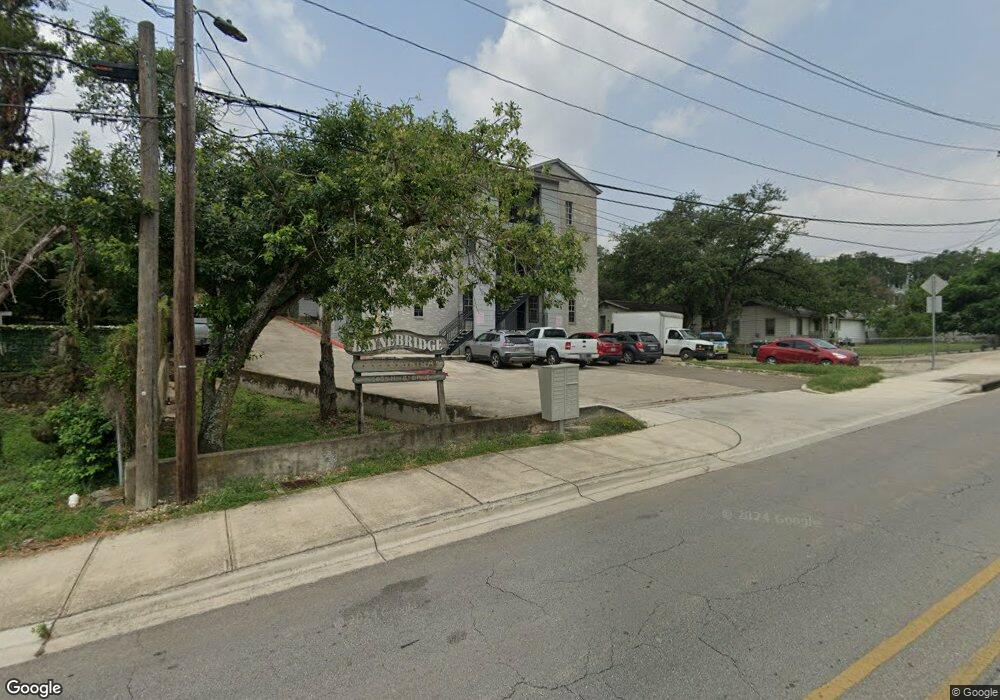
1005 N L B J Dr Unit A3 San Marcos, TX 78666
Estimated Value: $203,000 - $234,000
--
Bed
--
Bath
960
Sq Ft
$227/Sq Ft
Est. Value
About This Home
This home is located at 1005 N L B J Dr Unit A3, San Marcos, TX 78666 and is currently estimated at $218,365, approximately $227 per square foot. 1005 N L B J Dr Unit A3 is a home located in Hays County with nearby schools including Crockett Elementary School, Dorris Miller Middle School, and San Marcos High School.
Ownership History
Date
Name
Owned For
Owner Type
Purchase Details
Closed on
Jul 19, 2022
Sold by
Bobcat1 Investments Llc
Bought by
Krohn Robert C
Current Estimated Value
Home Financials for this Owner
Home Financials are based on the most recent Mortgage that was taken out on this home.
Original Mortgage
$188,000
Outstanding Balance
$179,076
Interest Rate
5.23%
Mortgage Type
New Conventional
Estimated Equity
$39,289
Purchase Details
Closed on
Jun 21, 2004
Sold by
Kraenzel John W and Kraenzel Gail L
Bought by
Svajda Thomas and Svajda Anita
Home Financials for this Owner
Home Financials are based on the most recent Mortgage that was taken out on this home.
Original Mortgage
$53,600
Interest Rate
6.32%
Mortgage Type
Purchase Money Mortgage
Purchase Details
Closed on
Aug 18, 1999
Sold by
Garza Ruben
Bought by
R Bar P Realty Investments Llc
Create a Home Valuation Report for This Property
The Home Valuation Report is an in-depth analysis detailing your home's value as well as a comparison with similar homes in the area
Home Values in the Area
Average Home Value in this Area
Purchase History
| Date | Buyer | Sale Price | Title Company |
|---|---|---|---|
| Krohn Robert C | -- | Chicago Title | |
| Svajda Thomas | -- | Fidelity National Title | |
| R Bar P Realty Investments Llc | -- | -- |
Source: Public Records
Mortgage History
| Date | Status | Borrower | Loan Amount |
|---|---|---|---|
| Open | Krohn Robert C | $188,000 | |
| Previous Owner | Svajda Thomas | $53,600 |
Source: Public Records
Tax History Compared to Growth
Tax History
| Year | Tax Paid | Tax Assessment Tax Assessment Total Assessment is a certain percentage of the fair market value that is determined by local assessors to be the total taxable value of land and additions on the property. | Land | Improvement |
|---|---|---|---|---|
| 2025 | $4,741 | $239,210 | $57,420 | $181,790 |
| 2024 | $4,741 | $240,860 | $57,690 | $183,170 |
| 2023 | $4,292 | $225,650 | $57,690 | $167,960 |
| 2022 | $3,359 | $163,920 | $32,590 | $131,330 |
| 2021 | $2,173 | $98,590 | $16,940 | $81,650 |
| 2020 | $2,173 | $98,590 | $16,940 | $81,650 |
| 2019 | $2,427 | $98,590 | $16,940 | $81,650 |
| 2018 | $2,438 | $98,590 | $16,940 | $81,650 |
| 2017 | $1,720 | $71,520 | $0 | $71,520 |
| 2016 | $1,720 | $71,520 | $0 | $71,520 |
| 2015 | $1,726 | $71,520 | $0 | $71,520 |
Source: Public Records
Map
Nearby Homes
- 905 N Lbj Dr
- 1013 Chestnut St
- 1013 Chestnut St Unit 6
- 1013 Chestnut St Unit Building C, Unit 5
- 1013 Chestnut St Unit 4
- 206 Yale St
- 71 Elm Hill Ct
- 1102 Academy St
- 211 Ridgewood Dr
- 108 Flora Vista St
- 144 Flora Vista St
- 420 Salamander St
- 103 Sierra Ridge Dr
- 2 Tanglewood Trail
- 120 Rosa Rd
- Tbd Hugo Rd
- 118 Yaupon Ct
- 903 Sagewood Trail Unit 905
- 821 Old Ranch Road 12
- 105 Yaupon Ct
- 1005 N L B J Dr
- 1005 N L B J Dr
- 1005 N L B J Dr Unit B3
- 1005 N L B J Dr
- 1005 N L B J Dr
- 1005 N L B J Dr
- 1005 N L B J Dr
- 1005 N L B J Dr
- 1005 N L B J Dr Unit A2
- 1005 N L B J Dr
- 1005 N L B J Dr
- 1005 N L B J Dr Unit A6
- 1005 N L B J Dr Unit A4
- 1005 N Lbj Dr Unit A4
- 1005 N Lbj Dr Unit 1
- 1005 N Lbj Dr Unit A2
- 1005 N Lbj Dr Unit B6
- 1005 N Lbj Dr Unit A3
- 1005 N Lbj Dr Unit B4
- 1005 N Lbj Dr Unit A6