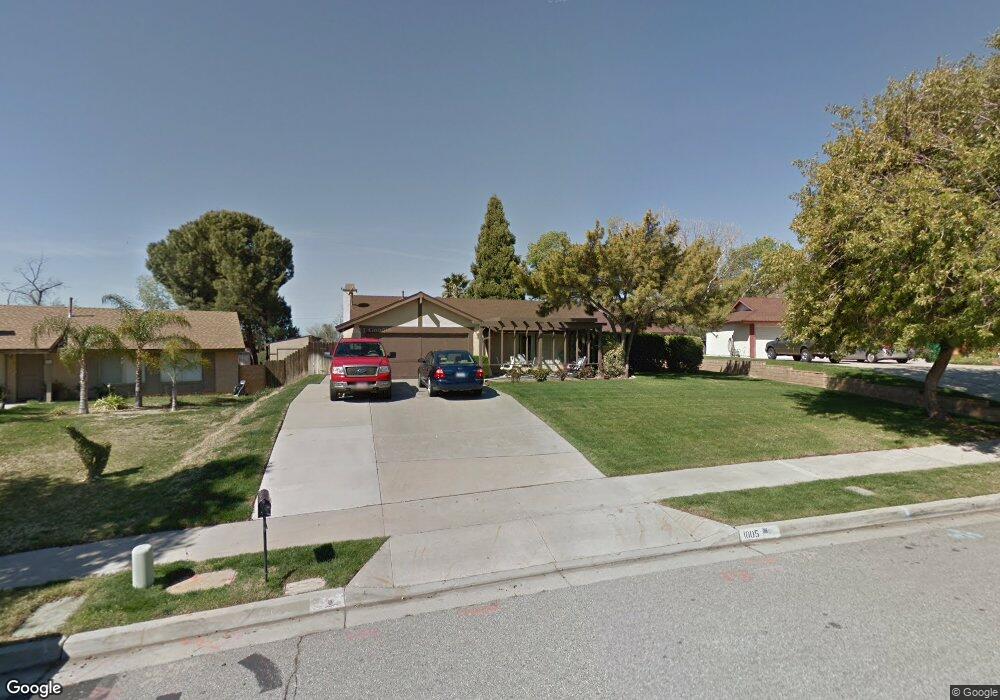
1005 Paseo Del Sol Banning, CA 92220
Estimated Value: $388,000 - $572,000
5
Beds
3
Baths
2,120
Sq Ft
$225/Sq Ft
Est. Value
About This Home
This home is located at 1005 Paseo Del Sol, Banning, CA 92220 and is currently estimated at $476,942, approximately $224 per square foot. 1005 Paseo Del Sol is a home located in Riverside County with nearby schools including Banning High School and Young Scholar Education Center.
Ownership History
Date
Name
Owned For
Owner Type
Purchase Details
Closed on
Jul 8, 2015
Sold by
Hinch Carl J and Hinch Roberta
Bought by
Hinch Robert M and Hinch Jennifer L
Current Estimated Value
Home Financials for this Owner
Home Financials are based on the most recent Mortgage that was taken out on this home.
Original Mortgage
$206,196
Outstanding Balance
$161,451
Interest Rate
3.98%
Mortgage Type
FHA
Estimated Equity
$315,491
Purchase Details
Closed on
Mar 9, 2007
Sold by
Hinch Carl J and Hinch Roberta
Bought by
Hinch Carl J and Hinch Roberta
Purchase Details
Closed on
Dec 16, 2002
Sold by
Va
Bought by
Hinch Carl J and Hinch Roberta
Home Financials for this Owner
Home Financials are based on the most recent Mortgage that was taken out on this home.
Original Mortgage
$120,000
Interest Rate
5.86%
Mortgage Type
Purchase Money Mortgage
Purchase Details
Closed on
Apr 12, 1995
Sold by
Wong Wing Y and Wong Ming K
Bought by
Va
Create a Home Valuation Report for This Property
The Home Valuation Report is an in-depth analysis detailing your home's value as well as a comparison with similar homes in the area
Home Values in the Area
Average Home Value in this Area
Purchase History
| Date | Buyer | Sale Price | Title Company |
|---|---|---|---|
| Hinch Robert M | $210,000 | Title365 | |
| Hinch Carl J | -- | None Available | |
| Hinch Carl J | -- | -- | |
| Va | $98,000 | Gateway Title Company |
Source: Public Records
Mortgage History
| Date | Status | Borrower | Loan Amount |
|---|---|---|---|
| Open | Hinch Robert M | $206,196 | |
| Previous Owner | Hinch Carl J | $120,000 |
Source: Public Records
Tax History
| Year | Tax Paid | Tax Assessment Tax Assessment Total Assessment is a certain percentage of the fair market value that is determined by local assessors to be the total taxable value of land and additions on the property. | Land | Improvement |
|---|---|---|---|---|
| 2025 | $3,098 | $225,487 | $57,917 | $167,570 |
| 2023 | $3,098 | $216,733 | $55,669 | $161,064 |
| 2022 | $3,032 | $212,484 | $54,578 | $157,906 |
| 2021 | $2,974 | $208,318 | $53,508 | $154,810 |
| 2020 | $2,948 | $206,183 | $52,960 | $153,223 |
| 2019 | $2,902 | $202,141 | $51,922 | $150,219 |
| 2018 | $2,884 | $198,178 | $50,905 | $147,273 |
| 2017 | $2,837 | $194,293 | $49,907 | $144,386 |
| 2016 | $2,698 | $190,484 | $48,929 | $141,555 |
| 2015 | $2,318 | $170,000 | $44,000 | $126,000 |
| 2014 | $2,348 | $170,000 | $44,000 | $126,000 |
Source: Public Records
Map
Nearby Homes
- 1423 W Hoffer St
- 1193 W King St
- 1142 W King St
- 1332 Eagle Dr
- 1356 Eagle Dr
- 1397 Eagle Dr
- 1098 Silver Star Dr
- 1333 Horned Owl St
- 1318 Horned Owl St
- 1078 W King St
- 1236 Butterfly Way
- 1251 Butterfly Way
- 1213 Butterfly Way
- 2200 W Wilson St Unit 54
- 2200 W Wilson St Unit 82
- 2200 W Wilson St Unit 154
- 2200 W Wilson St Unit 69
- 2200 W Wilson St Unit 78
- 266 N 14th St
- 2301 W Wilson St
- 983 Paseo Del Sol
- 1029 Paseo Del Sol
- 971 Paseo Del Sol
- 1018 Paseo Del Sol
- 976 Paseo Del Sol
- 1045 Paseo Del Sol
- 945 Paseo Del Sol
- 1068 Paseo Del Sol
- 1505 W Hoffer St
- 1042 Paseo Del Sol
- 1481 W Hoffer St
- 923 Paseo Del Sol
- 1047 Via Panorama
- 1461 W Hoffer St
- 1492 W Hoffer St
- 899 Paseo Del Sol
- 1472 W Hoffer St
- 871 Paseo Del Sol
- 977 Via Panorama
Your Personal Tour Guide
Ask me questions while you tour the home.