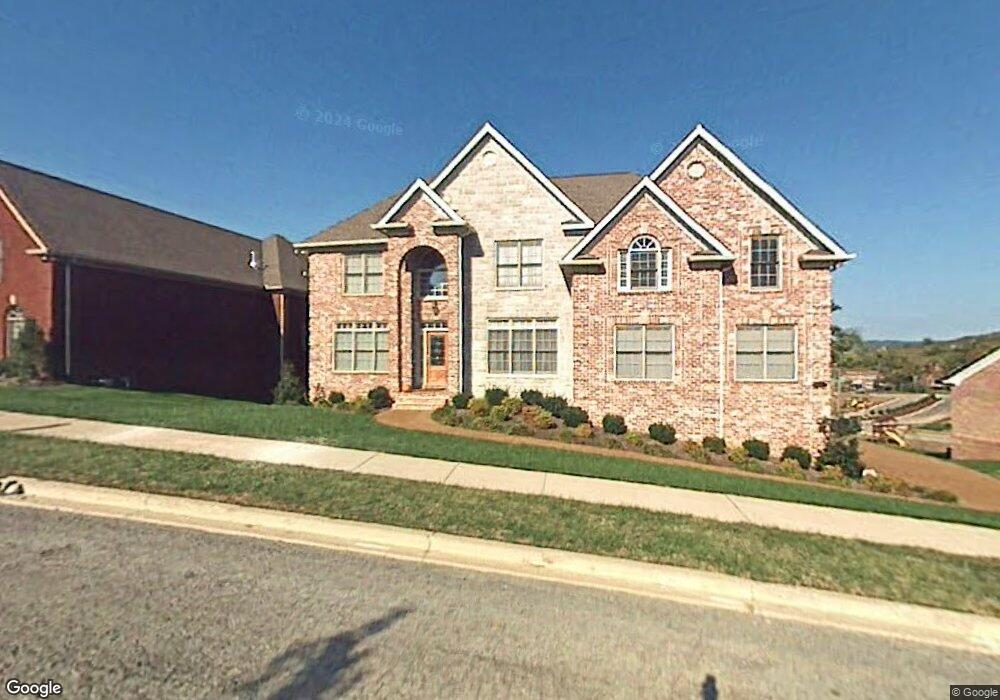
1005 Violet Dr Franklin, TN 37067
Estimated Value: $1,249,000 - $1,395,000
4
Beds
5
Baths
3,839
Sq Ft
$343/Sq Ft
Est. Value
About This Home
This home is located at 1005 Violet Dr, Franklin, TN 37067 and is currently estimated at $1,317,780, approximately $343 per square foot. 1005 Violet Dr is a home located in Williamson County with nearby schools including Clovercroft Elementary School, Fred J. Page Middle School, and Centennial High School.
Ownership History
Date
Name
Owned For
Owner Type
Purchase Details
Closed on
Jun 9, 2016
Sold by
Church Hackman and Church Laura R
Bought by
Stocia Monica D and Stocia Radu C
Current Estimated Value
Home Financials for this Owner
Home Financials are based on the most recent Mortgage that was taken out on this home.
Original Mortgage
$518,400
Outstanding Balance
$424,633
Interest Rate
4.5%
Mortgage Type
Adjustable Rate Mortgage/ARM
Estimated Equity
$893,147
Purchase Details
Closed on
Dec 2, 2005
Sold by
Tennessee Valley Homes Inc
Bought by
Hackman Robert J and Church Laura R
Home Financials for this Owner
Home Financials are based on the most recent Mortgage that was taken out on this home.
Original Mortgage
$425,000
Interest Rate
6.04%
Mortgage Type
Fannie Mae Freddie Mac
Create a Home Valuation Report for This Property
The Home Valuation Report is an in-depth analysis detailing your home's value as well as a comparison with similar homes in the area
Home Values in the Area
Average Home Value in this Area
Purchase History
| Date | Buyer | Sale Price | Title Company |
|---|---|---|---|
| Stocia Monica D | $648,000 | Chapman & Rosenthal Title In | |
| Hackman Robert J | $550,000 | -- |
Source: Public Records
Mortgage History
| Date | Status | Borrower | Loan Amount |
|---|---|---|---|
| Open | Stoica Monica D | $500,000 | |
| Closed | Stoica Monica D | $494,500 | |
| Closed | Stocia Monica D | $518,400 | |
| Previous Owner | Church Laura R | $408,459 | |
| Previous Owner | Church Laura R | $417,000 | |
| Previous Owner | Hackman Robert J | $425,000 |
Source: Public Records
Tax History Compared to Growth
Tax History
| Year | Tax Paid | Tax Assessment Tax Assessment Total Assessment is a certain percentage of the fair market value that is determined by local assessors to be the total taxable value of land and additions on the property. | Land | Improvement |
|---|---|---|---|---|
| 2024 | $4,002 | $185,625 | $35,000 | $150,625 |
| 2023 | $4,002 | $185,625 | $35,000 | $150,625 |
| 2022 | $4,002 | $185,625 | $35,000 | $150,625 |
| 2021 | $4,002 | $185,625 | $35,000 | $150,625 |
| 2020 | $4,193 | $162,700 | $25,000 | $137,700 |
| 2019 | $4,193 | $162,700 | $25,000 | $137,700 |
| 2018 | $4,079 | $162,700 | $25,000 | $137,700 |
| 2017 | $4,047 | $162,700 | $25,000 | $137,700 |
| 2016 | $0 | $162,700 | $25,000 | $137,700 |
| 2015 | -- | $143,500 | $23,750 | $119,750 |
| 2014 | -- | $143,500 | $23,750 | $119,750 |
Source: Public Records
Map
Nearby Homes
- 3025 Coral Bell Ln
- 3006 Coral Bell Ln
- 3005 Coral Bell Ln
- 123 Snapdragon Ct
- 1013 Candytuft Ct
- 1509 Liberty Pike
- 4092 Clovercroft Rd
- 1509 Decatur Cir
- 1033 Dunrobin Dr
- 1033 Park Run Dr
- 1027 Park Run Dr Unit 1027
- 1934 Turning Wheel Ln
- 3016 Westerly Dr
- 111 Guineveres Retreat
- 3061 Oxford Glen Dr
- 1222 Broadmoor Cir
- 1422 Marrimans Ct
- 513 King Richards Ct
- 1406 Burnside Dr
- 3085 Oxford Glen Dr
- 1003 Violet Dr
- 1007 Violet Dr
- 2020 Daylily Dr
- 1001 Violet Dr
- 1006 Violet Dr
- 2024 Daylily Dr
- 1004 Violet Dr
- 3022 Coral Bell Ln
- 3019 Coral Bell Ln
- 3027 Coral Bell Ln
- 2026 Daylily Dr
- 3024 Coral Bell Ln
- 2021 Daylily Dr
- 3015 Coral Bell Ln
- 2023 Daylily Dr
- 3028 Coral Bell Ln
- 2030 Daylily Dr
- 3029 Coral Bell Ln
- 2025 Daylily Dr
- 3011 Coral Bell Ln