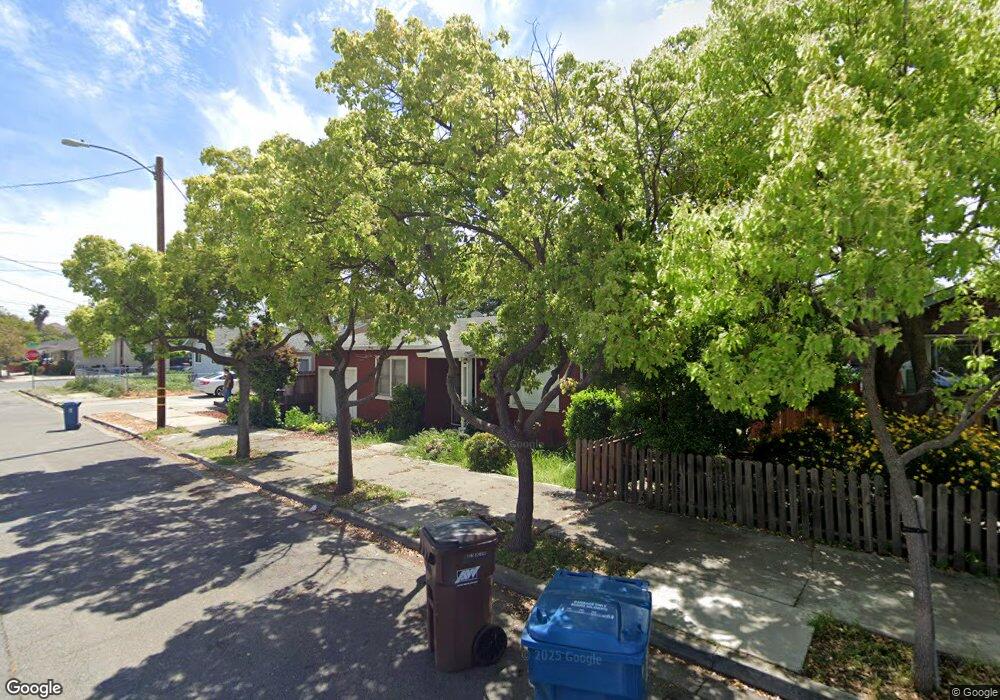
1005 W 7th St Antioch, CA 94509
North Antioch NeighborhoodEstimated Value: $354,892 - $478,000
3
Beds
2
Baths
1,251
Sq Ft
$335/Sq Ft
Est. Value
About This Home
This home is located at 1005 W 7th St, Antioch, CA 94509 and is currently estimated at $419,631, approximately $335 per square foot. 1005 W 7th St is a home located in Contra Costa County with nearby schools including Fremont Elementary School, Antioch Middle School, and Antioch High School.
Ownership History
Date
Name
Owned For
Owner Type
Purchase Details
Closed on
Feb 20, 2017
Sold by
Banga Steven
Bought by
Banga Steven and Banga Ajay
Current Estimated Value
Home Financials for this Owner
Home Financials are based on the most recent Mortgage that was taken out on this home.
Original Mortgage
$205,000
Outstanding Balance
$169,206
Interest Rate
4.09%
Mortgage Type
New Conventional
Estimated Equity
$250,425
Purchase Details
Closed on
Dec 3, 2012
Sold by
Singh Hardial
Bought by
Banga Steven
Home Financials for this Owner
Home Financials are based on the most recent Mortgage that was taken out on this home.
Original Mortgage
$101,500
Interest Rate
3.35%
Mortgage Type
New Conventional
Purchase Details
Closed on
Oct 27, 2008
Sold by
Kaur Kulwant
Bought by
Singh Hardial
Purchase Details
Closed on
Oct 23, 2008
Sold by
Hsbc Bank Usa National Association
Bought by
Singh Hardial
Purchase Details
Closed on
Jan 14, 2008
Sold by
Avila Martin and Avila Georgina
Bought by
Hsbc Bank Usa Na
Purchase Details
Closed on
Jun 18, 2001
Sold by
Avila Martin and Avila Georgina
Bought by
Avila Martin and Avila Georgina
Home Financials for this Owner
Home Financials are based on the most recent Mortgage that was taken out on this home.
Original Mortgage
$140,000
Interest Rate
7.14%
Mortgage Type
Purchase Money Mortgage
Purchase Details
Closed on
Mar 26, 1999
Sold by
Agape Villages
Bought by
Avila Martin and Avila Georgina
Home Financials for this Owner
Home Financials are based on the most recent Mortgage that was taken out on this home.
Original Mortgage
$117,587
Interest Rate
6.79%
Mortgage Type
FHA
Purchase Details
Closed on
Apr 15, 1998
Sold by
Hud
Bought by
Agape Villages Inc
Home Financials for this Owner
Home Financials are based on the most recent Mortgage that was taken out on this home.
Original Mortgage
$97,570
Interest Rate
7.17%
Mortgage Type
FHA
Purchase Details
Closed on
Nov 3, 1997
Sold by
Union Planters National Bank
Bought by
Hud
Purchase Details
Closed on
Oct 30, 1997
Sold by
Cyndee Koskey
Bought by
Union Planters National Bank
Create a Home Valuation Report for This Property
The Home Valuation Report is an in-depth analysis detailing your home's value as well as a comparison with similar homes in the area
Home Values in the Area
Average Home Value in this Area
Purchase History
| Date | Buyer | Sale Price | Title Company |
|---|---|---|---|
| Banga Steven | $102,500 | Orange Coast Title Company | |
| Banga Steven | $145,000 | First American Title Company | |
| Singh Hardial | -- | First American Title Company | |
| Singh Hardial | $80,000 | First American Title Company | |
| Hsbc Bank Usa Na | $328,500 | Landsafe | |
| Avila Martin | -- | Chicago Title Co | |
| Avila Martin | $118,000 | North American Title Co | |
| Agape Villages Inc | $10,000 | North American Title Co | |
| Hud | -- | -- | |
| Union Planters National Bank | $96,164 | Benefit Land Title Ins Co |
Source: Public Records
Mortgage History
| Date | Status | Borrower | Loan Amount |
|---|---|---|---|
| Open | Banga Steven | $205,000 | |
| Closed | Banga Steven | $101,500 | |
| Previous Owner | Avila Martin | $140,000 | |
| Previous Owner | Avila Martin | $117,587 | |
| Previous Owner | Agape Villages Inc | $97,570 |
Source: Public Records
Tax History
| Year | Tax Paid | Tax Assessment Tax Assessment Total Assessment is a certain percentage of the fair market value that is determined by local assessors to be the total taxable value of land and additions on the property. | Land | Improvement |
|---|---|---|---|---|
| 2025 | $3,626 | $178,547 | $55,409 | $123,138 |
| 2024 | $3,348 | $175,047 | $54,323 | $120,724 |
| 2023 | $3,348 | $171,615 | $53,258 | $118,357 |
| 2022 | $3,314 | $168,251 | $52,214 | $116,037 |
| 2021 | $3,182 | $164,953 | $51,191 | $113,762 |
| 2019 | $3,058 | $160,063 | $49,674 | $110,389 |
| 2018 | $2,946 | $156,925 | $48,700 | $108,225 |
| 2017 | $2,844 | $153,849 | $47,746 | $106,103 |
| 2016 | $2,742 | $150,833 | $46,810 | $104,023 |
| 2015 | $2,598 | $148,568 | $46,107 | $102,461 |
| 2014 | $2,497 | $145,658 | $45,204 | $100,454 |
Source: Public Records
Map
Nearby Homes
- 1112 W 6th St
- 806 W 7th St
- 0 W 4th St
- 809 W 2nd St
- 811 G St Unit 811 and 811 1/2
- 1143 Cook St
- 810 F St
- 814 F St
- 613 W 13th St
- 310 W 10th St
- 301 W 3rd St
- 500 W 16th St
- 1214 Sycamore Dr Unit 3
- 106 W 10th St
- 1504 Sycamore Dr
- 1508 Sycamore Dr
- 2104 Lemontree Way Unit 1
- 2108 Lemontree Way Unit 3
- 2110 Peppertree Way Unit 1
- 606 W 20th St
Your Personal Tour Guide
Ask me questions while you tour the home.