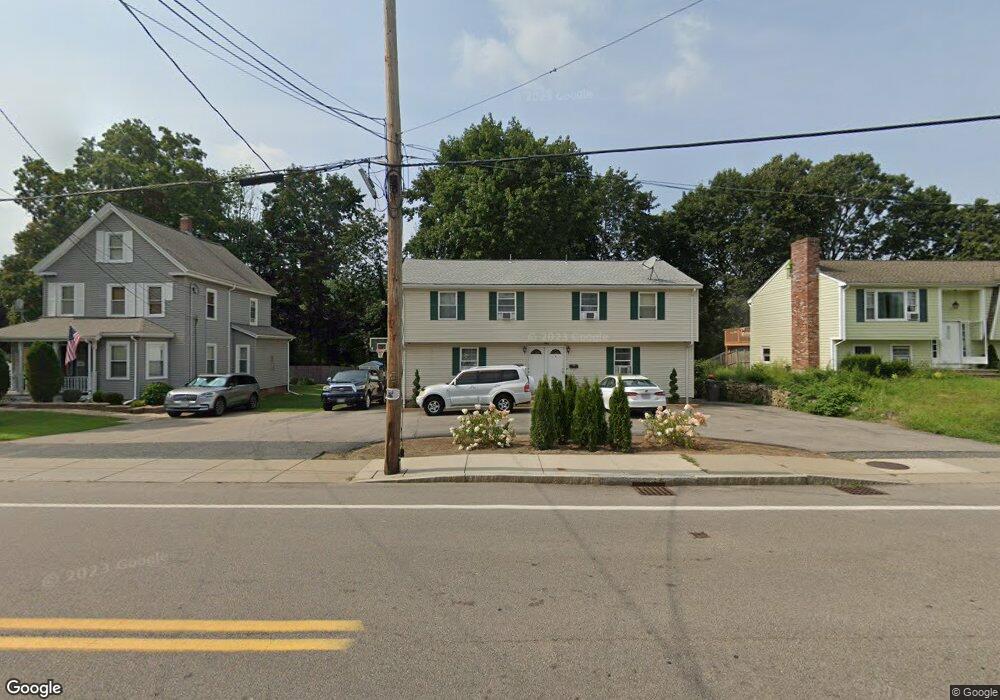
1005 Waverley St Unit 1005 Framingham, MA 01702
Estimated Value: $674,128 - $876,000
3
Beds
2
Baths
1,300
Sq Ft
$601/Sq Ft
Est. Value
About This Home
This home is located at 1005 Waverley St Unit 1005, Framingham, MA 01702 and is currently estimated at $781,032, approximately $600 per square foot. 1005 Waverley St Unit 1005 is a home located in Middlesex County with nearby schools including Framingham High School, Pincushion Hill Montessori School, and Saint Bridget School.
Ownership History
Date
Name
Owned For
Owner Type
Purchase Details
Closed on
Mar 21, 2017
Sold by
Castaneda Henry G and Castaneda Luz M
Bought by
Castaneda Rt and Castaneda
Current Estimated Value
Purchase Details
Closed on
Sep 27, 1999
Sold by
Dicenso Laura and Dicenso Enrico
Bought by
Castaneda Henry G and Castaneda Luz M
Home Financials for this Owner
Home Financials are based on the most recent Mortgage that was taken out on this home.
Original Mortgage
$235,800
Interest Rate
8.1%
Mortgage Type
Purchase Money Mortgage
Purchase Details
Closed on
Apr 17, 1996
Sold by
Serenity Inc
Bought by
Dicenso Enrico and Dicenso Donna
Home Financials for this Owner
Home Financials are based on the most recent Mortgage that was taken out on this home.
Original Mortgage
$94,000
Interest Rate
7.34%
Mortgage Type
Purchase Money Mortgage
Create a Home Valuation Report for This Property
The Home Valuation Report is an in-depth analysis detailing your home's value as well as a comparison with similar homes in the area
Home Values in the Area
Average Home Value in this Area
Purchase History
| Date | Buyer | Sale Price | Title Company |
|---|---|---|---|
| Castaneda Rt | -- | -- | |
| Castaneda Rt | -- | -- | |
| Castaneda Henry G | $264,000 | -- | |
| Dicenso Enrico | $117,500 | -- | |
| Dicenso Enrico | $117,500 | -- |
Source: Public Records
Mortgage History
| Date | Status | Borrower | Loan Amount |
|---|---|---|---|
| Previous Owner | Dicenso Enrico | $236,000 | |
| Previous Owner | Dicenso Enrico | $235,800 | |
| Previous Owner | Dicenso Enrico | $92,000 | |
| Previous Owner | Dicenso Enrico | $94,000 |
Source: Public Records
Tax History Compared to Growth
Tax History
| Year | Tax Paid | Tax Assessment Tax Assessment Total Assessment is a certain percentage of the fair market value that is determined by local assessors to be the total taxable value of land and additions on the property. | Land | Improvement |
|---|---|---|---|---|
| 2025 | $6,818 | $571,000 | $202,600 | $368,400 |
| 2024 | $6,610 | $530,500 | $180,100 | $350,400 |
| 2023 | $6,422 | $490,600 | $161,000 | $329,600 |
| 2022 | $6,340 | $461,400 | $146,000 | $315,400 |
| 2021 | $6,110 | $434,900 | $140,300 | $294,600 |
| 2020 | $5,802 | $387,300 | $122,300 | $265,000 |
| 2019 | $5,114 | $332,500 | $116,500 | $216,000 |
| 2018 | $4,899 | $300,200 | $108,500 | $191,700 |
| 2017 | $4,662 | $279,000 | $104,400 | $174,600 |
| 2016 | $4,613 | $265,400 | $98,700 | $166,700 |
| 2015 | $4,485 | $251,700 | $99,700 | $152,000 |
Source: Public Records
Map
Nearby Homes
- 8 Bellmore Rd
- 15 Bellmore Rd
- 45 Daytona Ave
- 51 Crest Rd
- 818 Waverly St
- 116 Waverly St
- 84 Bethany Rd
- 12 & 14 Waverly St
- 327 Singletary Ln
- 131 Mellen St Unit 3B
- 292 Hollis St
- 302 Hollis St Unit R
- 67 Long Ave
- 120 Franklin St
- 13 Washington Ave
- 450 Mount Wayte Ave
- 77 Arlington St
- 29 Gordon St Unit 107
- 25 Eames St
- 342 Franklin St
- 1005 Waverley St
- 1001 Waverly St
- 1007 Waverly St
- 999 Waverly St
- 997 Waverly St
- 1015 Waverly St
- 1000 Waverly St
- 1000 Waverly St Unit 2
- 1019 Waverly St
- 1010 Waverly St
- 1012 Waverly St
- 1025 Waverly St Unit B
- 1025 Waverly St Unit A
- 1025 Waverly St Unit B,1025
- 2 Pershing Ave Unit 2A
- 2 Pershing Ave
- 980 Waverly St
- 8 Waverly Ln
- 1012 1014 Waverly
- 12 Waverly Ln