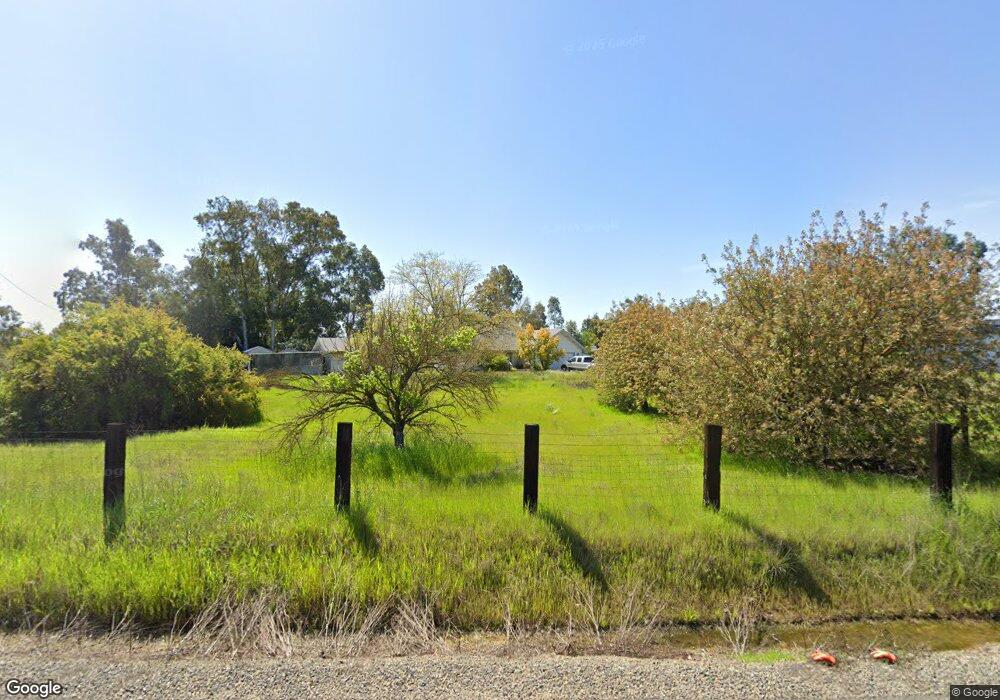
10050 Calvine Rd Sacramento, CA 95829
North East Elk Grove NeighborhoodEstimated Value: $598,000 - $1,340,000
3
Beds
2
Baths
1,876
Sq Ft
$493/Sq Ft
Est. Value
About This Home
This home is located at 10050 Calvine Rd, Sacramento, CA 95829 and is currently estimated at $925,688, approximately $493 per square foot. 10050 Calvine Rd is a home located in Sacramento County with nearby schools including Pleasant Grove Elementary School, Katherine L. Albiani Middle School, and Pleasant Grove High School.
Ownership History
Date
Name
Owned For
Owner Type
Purchase Details
Closed on
Apr 2, 2015
Sold by
Joseph Irving B
Bought by
Olson Brett
Current Estimated Value
Purchase Details
Closed on
Mar 13, 2015
Sold by
Olson Alan F
Bought by
Olson Brett
Purchase Details
Closed on
Dec 13, 2012
Sold by
Short Ernest H
Bought by
Short Ernest H
Purchase Details
Closed on
Jul 9, 2012
Sold by
Short Ernest H
Bought by
Short Ernest H
Purchase Details
Closed on
Jun 14, 2012
Sold by
Olson Alan F
Bought by
Short Ernest H
Purchase Details
Closed on
Jan 22, 1998
Sold by
Olson Alan F
Bought by
N B Revocable Trust
Purchase Details
Closed on
Jan 30, 1997
Sold by
Olson Alan F
Bought by
N B Revocable Trust
Purchase Details
Closed on
Dec 27, 1996
Sold by
Olson Enterprises L P
Bought by
Olson Alan F and Olson Virginia
Purchase Details
Closed on
Mar 16, 1995
Sold by
Olson Alan F and Olson Virginia
Bought by
Olson Enterprises L P
Create a Home Valuation Report for This Property
The Home Valuation Report is an in-depth analysis detailing your home's value as well as a comparison with similar homes in the area
Home Values in the Area
Average Home Value in this Area
Purchase History
| Date | Buyer | Sale Price | Title Company |
|---|---|---|---|
| Olson Brett | -- | None Available | |
| Olson Brett | -- | None Available | |
| Olson Alan F | -- | None Available | |
| Short Ernest H | -- | None Available | |
| Short Ernest H | -- | None Available | |
| Short Ernest H | -- | None Available | |
| N B Revocable Trust | -- | -- | |
| N B Revocable Trust | -- | -- | |
| N B Revocable Trust | -- | -- | |
| N B Revocable Trust | -- | -- | |
| Olson Alan F | -- | -- | |
| Joseph Irving B | -- | -- | |
| Olson Enterprises L P | $275,000 | -- |
Source: Public Records
Tax History Compared to Growth
Tax History
| Year | Tax Paid | Tax Assessment Tax Assessment Total Assessment is a certain percentage of the fair market value that is determined by local assessors to be the total taxable value of land and additions on the property. | Land | Improvement |
|---|---|---|---|---|
| 2025 | $5,101 | $474,670 | $190,700 | $283,970 |
| 2024 | $5,101 | $465,363 | $186,961 | $278,402 |
| 2023 | $4,969 | $456,240 | $183,296 | $272,944 |
| 2022 | $4,877 | $447,295 | $179,702 | $267,593 |
| 2021 | $4,816 | $438,526 | $176,179 | $262,347 |
| 2020 | $4,738 | $434,030 | $174,373 | $259,657 |
| 2019 | $4,648 | $425,520 | $170,954 | $254,566 |
| 2018 | $4,519 | $417,177 | $167,602 | $249,575 |
| 2017 | $4,437 | $408,998 | $164,316 | $244,682 |
| 2016 | $4,206 | $400,980 | $161,095 | $239,885 |
| 2015 | $3,694 | $352,326 | $135,509 | $216,817 |
| 2014 | $3,632 | $345,425 | $132,855 | $212,570 |
Source: Public Records
Map
Nearby Homes
- 8312 Cabochon Way
- 10077 Cristo Dr
- 10174 Atlantis Dr
- 10042 Silver Meadow Way
- 8595 Mackey Rd
- 8696 Cherrington Ln
- 8688 Cherrington Ln
- 9980 Crystal Creek Dr
- 8580 Bradshaw Rd
- 9864 Wildhawk Dr W
- 9633 Respect Dr
- 9733 Everbloom Way
- 8600 Excelsior Rd
- 8850 Bader Rd
- 10050 Cameron Pines Way
- 8210 Scrimshaw Way
- 10571 Quiet Havens Ct
- 9492 Del Seis Dr
- 8294 Courage Dr
- 9929 Phoenician Way
- 10020 Calvine Rd
- 8372 Samwood Ct
- 8368 Samwood Ct
- 10028 Geode Ct
- 10032 Geode Ct
- 10060 Calvine Rd
- 10024 Geode Ct
- 10036 Dagwood Ct
- 9999 Calvine Rd
- 8365 Samwood Ct
- 10020 Geode Ct
- 10098 Calvine Rd
- 10022 Calvine Rd
- 8372 Kellwood Ct
- 10029 Geode Ct
- 10016 Geode Ct
- 10039 Dagwood Way
- 10042 Dagwood Way
- 8364 Kellwood Ct
- 10025 Geode Ct