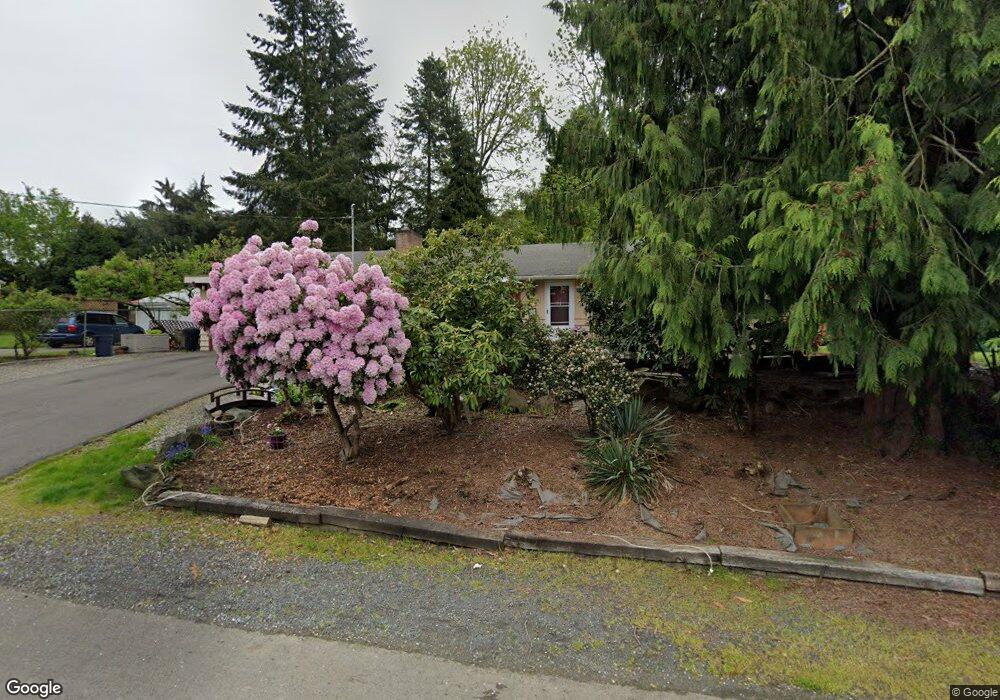
10052 29th Ave NE Seattle, WA 98125
Lake City NeighborhoodEstimated Value: $857,000 - $876,000
3
Beds
2
Baths
1,420
Sq Ft
$612/Sq Ft
Est. Value
About This Home
This home is located at 10052 29th Ave NE, Seattle, WA 98125 and is currently estimated at $868,566, approximately $611 per square foot. 10052 29th Ave NE is a home located in King County with nearby schools including Wedgwood Elementary School, Eckstein Middle School, and Nathan Hale High School.
Ownership History
Date
Name
Owned For
Owner Type
Purchase Details
Closed on
Jun 16, 2014
Sold by
Alconcher Jared V
Bought by
Alconcher Anthony J and Alconcher Eva
Current Estimated Value
Purchase Details
Closed on
Jun 9, 2014
Sold by
Alconcher Anthony J and Alconcher Eva V
Bought by
The Alconher Legacy Trust and Alconcher Eva V
Purchase Details
Closed on
Nov 19, 2002
Sold by
Parker Rex and Honeycutt Gayle M
Bought by
Alconcher Anthony J and Alconcher Eva
Home Financials for this Owner
Home Financials are based on the most recent Mortgage that was taken out on this home.
Original Mortgage
$236,241
Outstanding Balance
$98,004
Interest Rate
5.89%
Mortgage Type
FHA
Estimated Equity
$770,562
Purchase Details
Closed on
Jul 6, 2001
Sold by
Hurst Richard S and Hurst Kimberly K
Bought by
Parker Rex and Honeycutt Gayle M
Home Financials for this Owner
Home Financials are based on the most recent Mortgage that was taken out on this home.
Original Mortgage
$226,396
Interest Rate
7.24%
Mortgage Type
FHA
Create a Home Valuation Report for This Property
The Home Valuation Report is an in-depth analysis detailing your home's value as well as a comparison with similar homes in the area
Home Values in the Area
Average Home Value in this Area
Purchase History
| Date | Buyer | Sale Price | Title Company |
|---|---|---|---|
| Alconcher Anthony J | -- | None Available | |
| The Alconher Legacy Trust | -- | None Available | |
| Alconcher Anthony J | $251,000 | First American | |
| Parker Rex | $229,950 | Evergreen Title Company Inc |
Source: Public Records
Mortgage History
| Date | Status | Borrower | Loan Amount |
|---|---|---|---|
| Open | Alconcher Anthony J | $236,241 | |
| Previous Owner | Parker Rex | $226,396 |
Source: Public Records
Tax History Compared to Growth
Tax History
| Year | Tax Paid | Tax Assessment Tax Assessment Total Assessment is a certain percentage of the fair market value that is determined by local assessors to be the total taxable value of land and additions on the property. | Land | Improvement |
|---|---|---|---|---|
| 2024 | $8,514 | $786,000 | $481,000 | $305,000 |
| 2023 | $8,019 | $693,000 | $474,000 | $219,000 |
| 2022 | $7,068 | $834,000 | $527,000 | $307,000 |
| 2021 | $6,490 | $667,000 | $422,000 | $245,000 |
| 2020 | $6,552 | $579,000 | $367,000 | $212,000 |
| 2018 | $5,960 | $608,000 | $371,000 | $237,000 |
| 2017 | $5,075 | $530,000 | $324,000 | $206,000 |
| 2016 | $4,545 | $461,000 | $209,000 | $252,000 |
| 2015 | $3,934 | $426,000 | $193,000 | $233,000 |
| 2014 | -- | $375,000 | $172,000 | $203,000 |
| 2013 | -- | $337,000 | $158,000 | $179,000 |
Source: Public Records
Map
Nearby Homes
- 3215 NE 103rd St
- 2811 NE 105th St
- 2329 NE 103rd St
- 10505 24th Ave NE
- 3038 NE 95th St
- 2320 NE 102nd St
- 10519 24th Ave NE
- 10536 24th Ave NE
- 9517 35th Ave NE Unit 2A
- 2020 NE 102nd St
- 10340 39th Ave NE
- 2704 NE 92nd St
- 9400 35th Ave NE
- 9504 Ravenna Ave NE Unit 203
- 10422 20th Ave NE
- 2310 NE 94th St
- 2558 NE 91st St Unit A
- 2615 NE 113th St
- 3537 NE 93rd St
- 2718 NE 90th St
- 10040 29th Ave NE
- 10238 29th Ave NE
- 10033 31st Ave NE
- 3017 NE 103rd St
- 10035 31st Ave NE
- 10057 29th Ave NE
- 2753 NE 103rd St
- 3011 NE 103rd St
- 10051 29th Ave NE
- 10034 29th Ave NE
- 10036 29th Ave NE
- 10027 31st Ave NE
- 10045 29th Ave NE
- 2747 NE 103rd St
- 2751 NE 103rd St
- 10032 29th Ave NE
- 3023 NE 103rd St
- 10040 31st Ave NE
- 10038 31st Ave NE
- 10021 31st Ave NE