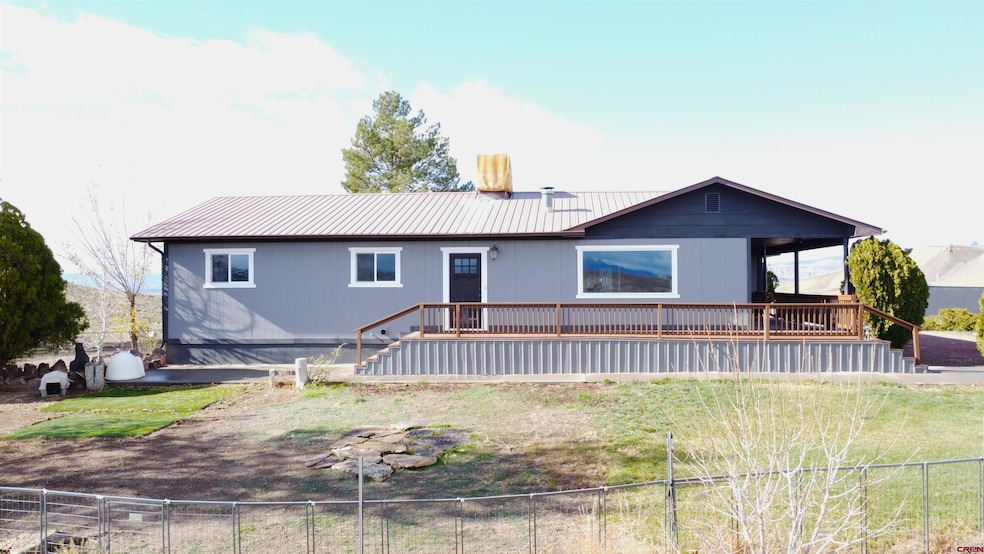
10053 2100 Rd Austin, CO 81410
Estimated payment $2,737/month
Highlights
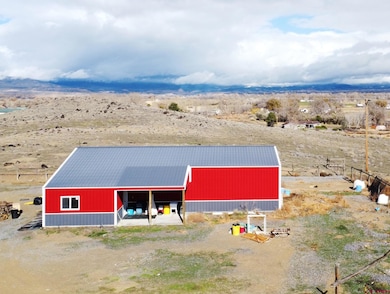
- Barn
- RV Hookup
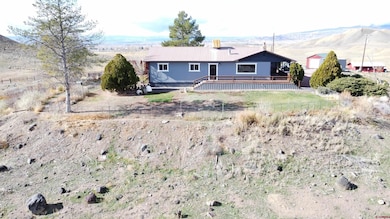
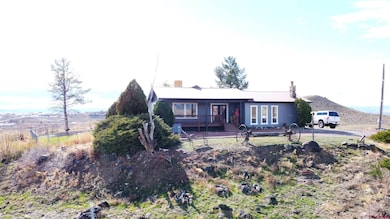
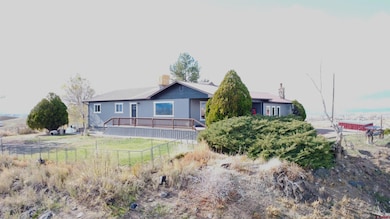
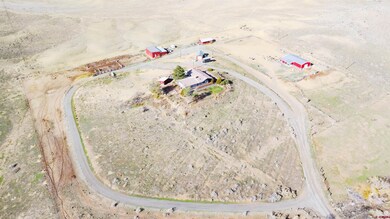
- Mountain View
- Horses Allowed On Property
- 12.88 Acre Lot
- Deck
About This Home
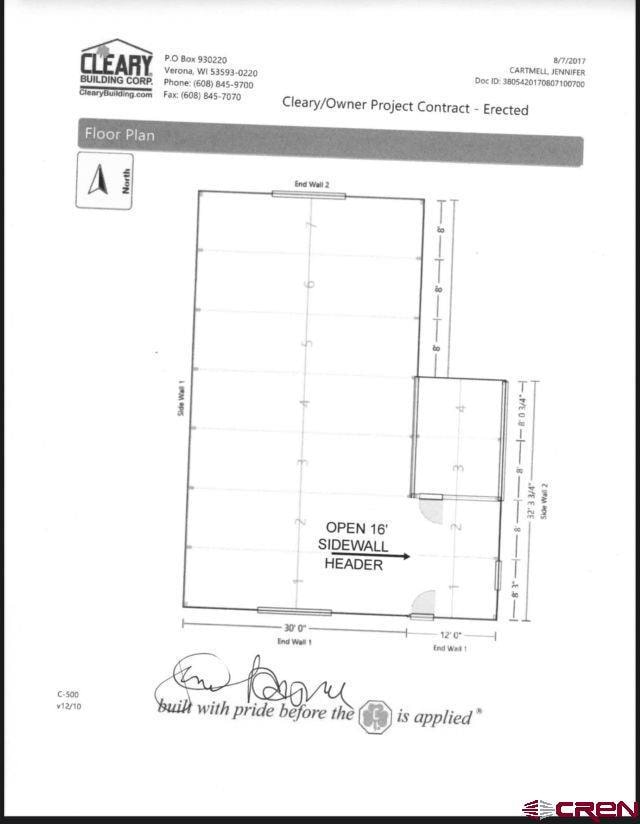
If you need space, views and a beautifully updated home then take a look at this place. Newly remodeled 3 bedroom 2 bath with 12.88 acres of land that includes 3 shares of OCID. Inside you will find newly installed porcelain tile flooring in the kitchen and dining area as well as solid quartz countertops with beautiful hickory cabinets as well as newer stainless steel appliances. The home has updated windows and electric. All of the outbuildings have electricity. The Cleary building is over 1600sqft with 50amp service, ready for stalls and has livestock water. The barn also has a tack room. There is plenty of room for the horses or cattle to enjoy, not to mention the fact that there are views for miles. NO COVENANTS OR HOA. Come take a look at this amazing property.
Home Details
Home Type
- Single Family
Est. Annual Taxes
- $2,022
Year Built
- Built in 1975 | Remodeled in 2024
Lot Details
- 12.88 Acre Lot
- Split Rail Fence
- Back and Front Yard Fenced
- Chain Link Fence
- Irrigation
Home Design
- Ranch Style House
- Metal Roof
- Siding
- Stick Built Home
Interior Spaces
- 1,984 Sq Ft Home
- Ceiling Fan
- Wood Burning Stove
- Self Contained Fireplace Unit Or Insert
- Double Pane Windows
- Vinyl Clad Windows
- Formal Dining Room
- Den with Fireplace
- Mountain Views
- Crawl Space
Kitchen
- Breakfast Bar
- Oven or Range
- Microwave
- Dishwasher
- Granite Countertops
Flooring
- Laminate
- Tile
Bedrooms and Bathrooms
- 3 Bedrooms
Laundry
- Dryer
- Washer
Parking
- Detached Garage
- RV Hookup
Outdoor Features
- Deck
- Covered Patio or Porch
- Shed
Schools
- Cedaredge K-5 Elementary School
- Cedaredge 6-8 Middle School
- Cedaredge 9-12 High School
Farming
- Barn
- 5 Irrigated Acres
- Cattle
Horse Facilities and Amenities
- Horses Allowed On Property
Utilities
- Evaporated cooling system
- Heating System Uses Wood
- Pellet Stove burns compressed wood to generate heat
- Irrigation Water Rights
- Septic Tank
- Septic System
- Internet Available
Listing and Financial Details
- Assessor Parcel Number 323726400025
- Special Tax Authority
Map
Tax History
| Year | Tax Paid | Tax Assessment Tax Assessment Total Assessment is a certain percentage of the fair market value that is determined by local assessors to be the total taxable value of land and additions on the property. | Land | Improvement |
|---|---|---|---|---|
| 2024 | $2,387 | $32,796 | $7,830 | $24,966 |
| 2023 | $2,387 | $32,796 | $7,830 | $24,966 |
| 2022 | $2,000 | $27,272 | $7,993 | $19,279 |
| 2021 | $2,004 | $28,057 | $8,223 | $19,834 |
| 2020 | $1,671 | $22,067 | $5,720 | $16,347 |
| 2019 | $1,652 | $22,067 | $5,720 | $16,347 |
| 2018 | $1,083 | $15,299 | $5,760 | $9,539 |
| 2017 | $1,051 | $15,047 | $5,760 | $9,287 |
| 2016 | $907 | $13,980 | $5,373 | $8,607 |
| 2014 | -- | $17,595 | $5,970 | $11,625 |
Property History
| Date | Event | Price | List to Sale | Price per Sq Ft |
|---|---|---|---|---|
| 02/12/2026 02/12/26 | Pending | -- | -- | -- |
| 01/30/2026 01/30/26 | Price Changed | $499,000 | -9.1% | $252 / Sq Ft |
| 12/24/2025 12/24/25 | Price Changed | $549,000 | -8.5% | $277 / Sq Ft |
| 12/06/2025 12/06/25 | Price Changed | $599,999 | -4.0% | $302 / Sq Ft |
| 11/20/2025 11/20/25 | For Sale | $624,999 | -- | $315 / Sq Ft |
Purchase History
| Date | Type | Sale Price | Title Company |
|---|---|---|---|
| Warranty Deed | $189,000 | Heritage Title Company | |
| Interfamily Deed Transfer | -- | Land Title Guarantee | |
| Quit Claim Deed | -- | Land Title Guarantee Company | |
| Warranty Deed | $214,000 | Land Title Guarantee Company |
Mortgage History
| Date | Status | Loan Amount | Loan Type |
|---|---|---|---|
| Open | $132,300 | Commercial | |
| Previous Owner | $203,300 | New Conventional |
Source: Colorado Real Estate Network (CREN)
MLS Number: 830029
APN: R023766
Disclaimer: Certain information contained herein is derived from information provided by parties other than Homes.com. All information provided is deemed reliable, but is not guaranteed to be accurate and should be independently verified.
![]() IDX information is provided exclusively for personal, non-commercial use, and may not be used for any purpose other than to identify prospective properties consumers may be interested in purchasing. Information is deemed reliable but not guaranteed.
IDX information is provided exclusively for personal, non-commercial use, and may not be used for any purpose other than to identify prospective properties consumers may be interested in purchasing. Information is deemed reliable but not guaranteed.
- 20812 Vista Grande Dr
- 10344 Kings View Rd
- 10465 2100 Rd
- 10487 2100 Rd
- 9808 Colorado 65
- 10712 Mesa View Dr
- 20028 Justice Rd
- 10081 Highway 65
- 20015 Kenosha Rd
- 9969 Kremmling Rd
- 9940 2150 Rd
- 20996 Fairview Rd
- TBD Fairview Rd Unit Residential Land
- TBD Fairview Rd Unit Commercial Land
- TBD Fairview (2007 Rd) Rd
- 21568 Austin Rd
- 20224 Lilac Ln
- 20194 Lilac Ct
- 20174 Lilac Ct
- 20177 Lilac Ct

Ask me questions while you tour the home.