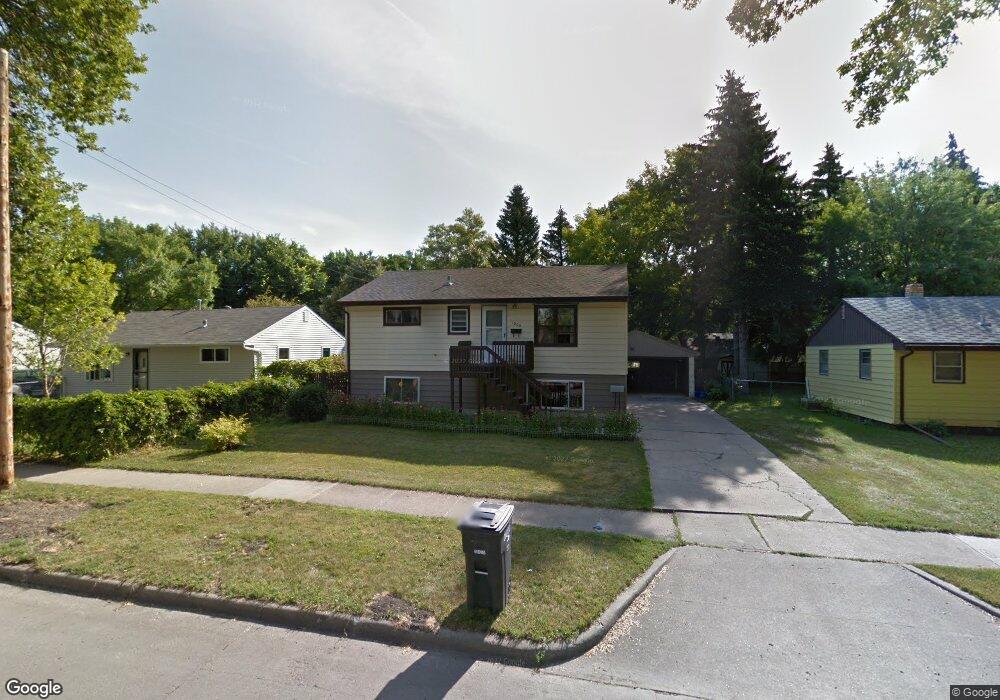
1006 21st St S Fargo, ND 58103
Jefferson-Carl NeighborhoodEstimated Value: $222,000 - $248,000
5
Beds
2
Baths
1,872
Sq Ft
$127/Sq Ft
Est. Value
About This Home
This home is located at 1006 21st St S, Fargo, ND 58103 and is currently estimated at $238,351, approximately $127 per square foot. 1006 21st St S is a home located in Cass County with nearby schools including Jefferson Elementary School, Carl Ben Eielson Middle School, and South High School.
Ownership History
Date
Name
Owned For
Owner Type
Purchase Details
Closed on
Jul 30, 2014
Sold by
Torkelson Russel M and Torkelson Loralee S
Bought by
Torkelson Russel M and Torkelson Loralee S
Current Estimated Value
Purchase Details
Closed on
Jun 1, 2012
Sold by
Le Krista K and Le Chris J
Bought by
Torkelson Russell and Torkelson Loralee
Create a Home Valuation Report for This Property
The Home Valuation Report is an in-depth analysis detailing your home's value as well as a comparison with similar homes in the area
Home Values in the Area
Average Home Value in this Area
Purchase History
| Date | Buyer | Sale Price | Title Company |
|---|---|---|---|
| Torkelson Russel M | -- | None Available | |
| Torkelson Russell | $120,000 | Title Co |
Source: Public Records
Tax History Compared to Growth
Tax History
| Year | Tax Paid | Tax Assessment Tax Assessment Total Assessment is a certain percentage of the fair market value that is determined by local assessors to be the total taxable value of land and additions on the property. | Land | Improvement |
|---|---|---|---|---|
| 2024 | $3,252 | $92,350 | $22,150 | $70,200 |
| 2023 | $3,144 | $88,800 | $22,150 | $66,650 |
| 2022 | $2,408 | $85,400 | $22,150 | $63,250 |
| 2021 | $2,366 | $85,400 | $22,150 | $63,250 |
| 2020 | $2,354 | $85,400 | $22,150 | $63,250 |
| 2019 | $2,131 | $76,350 | $13,150 | $63,200 |
| 2018 | $2,074 | $76,350 | $13,150 | $63,200 |
| 2017 | $1,996 | $74,150 | $13,150 | $61,000 |
| 2016 | $1,763 | $72,000 | $13,150 | $58,850 |
| 2015 | $1,866 | $71,600 | $9,000 | $62,600 |
| 2014 | $1,744 | $65,100 | $9,000 | $56,100 |
| 2013 | $1,643 | $60,850 | $9,000 | $51,850 |
Source: Public Records
Map
Nearby Homes
- 1129 22nd St S Unit B09
- 1129 22nd St S Unit B12
- 2009 13th Ave S
- 2013 13th Ave S
- 818 19th St S
- 814 19th St S
- 813 17th St S
- 1301 16 1 2 St S
- 1407 17th St S
- 2209 6th Ave S
- 2126 5th Ave S
- 2202 15th Ave S
- 2213 5th Ave S
- 1418 11th Ave S
- 2402 N Flickertail Dr S Unit 1
- 1418 12th Ave S
- 1414 10th Ave S
- 1524 5th Ave S
- 1402 E Gateway Cir S Unit M
- 402 23rd St S