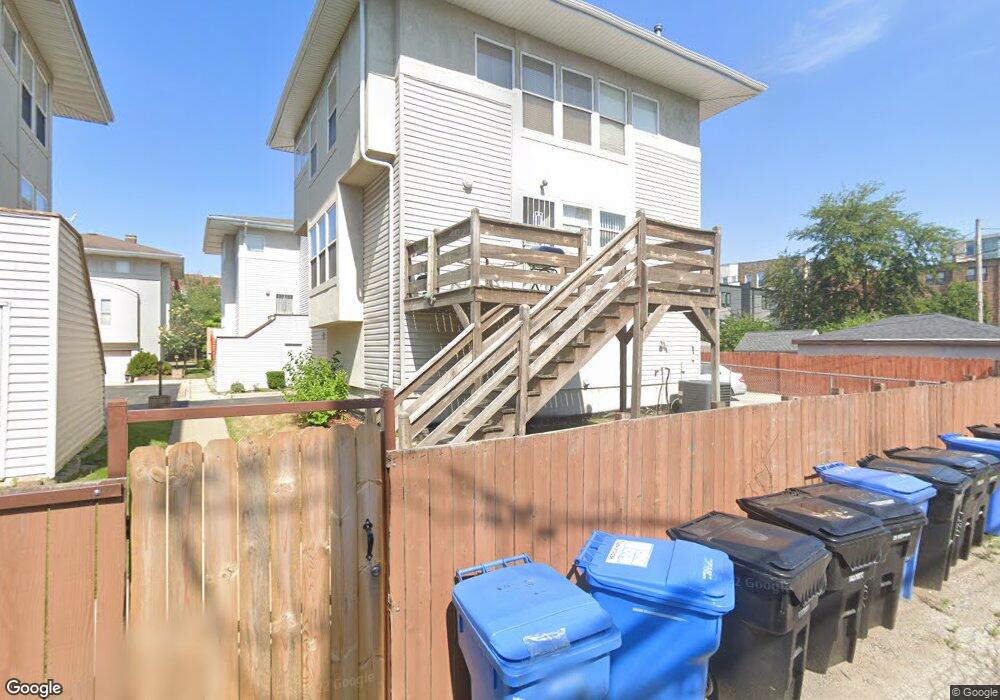
1006 E 62nd St Chicago, IL 60637
Woodlawn NeighborhoodEstimated Value: $472,118 - $564,000
3
Beds
2
Baths
1,668
Sq Ft
$317/Sq Ft
Est. Value
About This Home
This home is located at 1006 E 62nd St, Chicago, IL 60637 and is currently estimated at $528,530, approximately $316 per square foot. 1006 E 62nd St is a home located in Cook County with nearby schools including Fiske Elementary School, Hyde Park Academy High School, and Univ of Chicago Chtr-Woodlawn.
Ownership History
Date
Name
Owned For
Owner Type
Purchase Details
Closed on
Jul 16, 2014
Sold by
Federal Home Loan Mortgage Corporation
Bought by
Quindipan Jo Ann
Current Estimated Value
Home Financials for this Owner
Home Financials are based on the most recent Mortgage that was taken out on this home.
Original Mortgage
$237,500
Outstanding Balance
$179,930
Interest Rate
4.25%
Mortgage Type
New Conventional
Estimated Equity
$348,600
Purchase Details
Closed on
Jan 29, 2014
Sold by
Terry Cheryl D
Bought by
Federal Home Loan Mortgage Corporation
Purchase Details
Closed on
May 1, 1998
Sold by
Renaissance Thrush Joint Venture
Bought by
Terry Cheryl D
Home Financials for this Owner
Home Financials are based on the most recent Mortgage that was taken out on this home.
Original Mortgage
$181,350
Interest Rate
10.12%
Create a Home Valuation Report for This Property
The Home Valuation Report is an in-depth analysis detailing your home's value as well as a comparison with similar homes in the area
Home Values in the Area
Average Home Value in this Area
Purchase History
| Date | Buyer | Sale Price | Title Company |
|---|---|---|---|
| Quindipan Jo Ann | $250,000 | Attorneys Title Guaranty Fun | |
| Federal Home Loan Mortgage Corporation | -- | None Available | |
| Terry Cheryl D | $202,000 | -- |
Source: Public Records
Mortgage History
| Date | Status | Borrower | Loan Amount |
|---|---|---|---|
| Open | Quindipan Jo Ann | $237,500 | |
| Previous Owner | Terry Cheryl D | $181,350 |
Source: Public Records
Tax History
| Year | Tax Paid | Tax Assessment Tax Assessment Total Assessment is a certain percentage of the fair market value that is determined by local assessors to be the total taxable value of land and additions on the property. | Land | Improvement |
|---|---|---|---|---|
| 2025 | $6,709 | $45,000 | $3,450 | $41,550 |
| 2024 | $6,709 | $45,000 | $3,450 | $41,550 |
| 2023 | $6,495 | $35,000 | $3,450 | $31,550 |
| 2022 | $6,495 | $35,000 | $3,450 | $31,550 |
| 2021 | $6,369 | $35,000 | $3,450 | $31,550 |
| 2020 | $4,830 | $24,782 | $3,036 | $21,746 |
| 2019 | $4,782 | $27,233 | $3,036 | $24,197 |
| 2018 | $4,701 | $27,233 | $3,036 | $24,197 |
| 2017 | $4,952 | $23,002 | $2,760 | $20,242 |
| 2016 | $4,607 | $23,002 | $2,760 | $20,242 |
| 2015 | $4,215 | $23,002 | $2,760 | $20,242 |
| 2014 | $2,234 | $14,611 | $2,208 | $12,403 |
| 2013 | $2,179 | $14,611 | $2,208 | $12,403 |
Source: Public Records
Map
Nearby Homes
- 6123 S Ellis Ave
- 967 E 62nd St Unit 2
- 965 E 62nd St Unit 1
- 6213 S Ellis Ave
- 953 E 61st St Unit 1E
- 6103 S Ingleside Ave Unit 1
- 6109 S Greenwood Ave
- 6104 S Ingleside Ave Unit CH
- 6201 S Drexel Ave
- 6411 S Drexel Ave
- 6409 S Drexel Ave
- 6321 S Ingleside Ave
- 6318 S Greenwood Ave Unit 1
- 6318 S Greenwood Ave Unit 2
- 6216 S Woodlawn Ave Unit F
- 6216 S Woodlawn Ave Unit E
- 6216 S Woodlawn Ave Unit A
- 6218 S Woodlawn Ave Unit A
- 6218 S Woodlawn Ave Unit F
- 6218 S Woodlawn Ave Unit H
- 1006 E 62nd St
- 1006 E 62nd St
- 1006 E 62nd St
- 1006 E 62nd St
- 1006 E 62nd St
- 1006 E 62nd St
- 1016 E 62nd St
- 6153 S Ellis Ave
- 1002 E 62nd St Unit 1006
- 1002 E 62nd St
- 1002 E 62nd St
- 1002 E 62nd St
- 1002 E 62nd St
- 1002 E 62nd St
- 1002 E 62nd St
- 6152 S Greenwood Ave
- 6152 S Greenwood Ave
- 6152 S Greenwood Ave
- 6152 S Greenwood Ave
- 6152 S Greenwood Ave Unit C
Your Personal Tour Guide
Ask me questions while you tour the home.