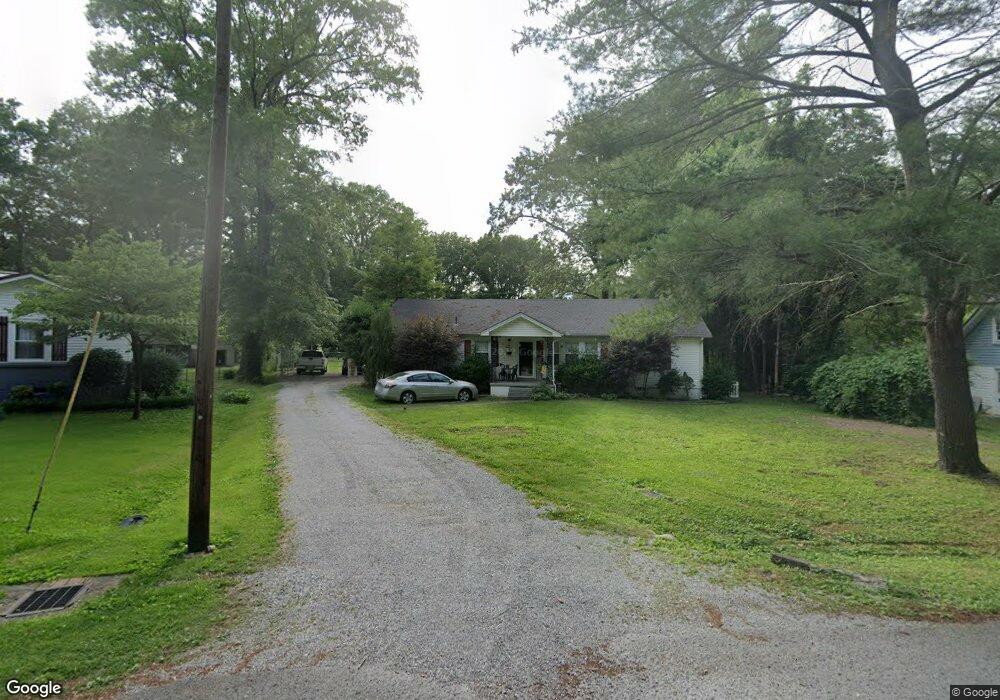
1006 Evins St Manchester, TN 37355
Estimated Value: $238,073 - $305,000
--
Bed
2
Baths
2,216
Sq Ft
$127/Sq Ft
Est. Value
About This Home
This home is located at 1006 Evins St, Manchester, TN 37355 and is currently estimated at $280,518, approximately $126 per square foot. 1006 Evins St is a home located in Coffee County with nearby schools including Westwood Middle School and Temple Baptist Christian School.
Ownership History
Date
Name
Owned For
Owner Type
Purchase Details
Closed on
Aug 28, 2024
Sold by
Reed Rebecca
Bought by
Reed Richard
Current Estimated Value
Purchase Details
Closed on
Jun 27, 2008
Sold by
Jones Aaron L
Bought by
Reed Richard
Purchase Details
Closed on
Mar 31, 2006
Bought by
Bank Of New York Trustee Mail Stop Ppx-C-35
Purchase Details
Closed on
Jul 9, 1997
Sold by
Hoffman Shirley
Bought by
Leonard Deborah
Purchase Details
Closed on
Jul 8, 1997
Bought by
Jane Leonard Deborah and Boyd Mary Katherine
Create a Home Valuation Report for This Property
The Home Valuation Report is an in-depth analysis detailing your home's value as well as a comparison with similar homes in the area
Home Values in the Area
Average Home Value in this Area
Purchase History
| Date | Buyer | Sale Price | Title Company |
|---|---|---|---|
| Reed Richard | -- | None Listed On Document | |
| Reed Richard | $152,900 | -- | |
| Bank Of New York Trustee Mail Stop Ppx-C-35 | $50,600 | -- | |
| Leonard Deborah | $54,750 | -- | |
| Jane Leonard Deborah | $54,800 | -- |
Source: Public Records
Tax History Compared to Growth
Tax History
| Year | Tax Paid | Tax Assessment Tax Assessment Total Assessment is a certain percentage of the fair market value that is determined by local assessors to be the total taxable value of land and additions on the property. | Land | Improvement |
|---|---|---|---|---|
| 2024 | $1,440 | $34,175 | $3,125 | $31,050 |
| 2023 | $1,440 | $34,175 | $0 | $0 |
| 2022 | $1,240 | $34,175 | $3,125 | $31,050 |
| 2021 | $1,241 | $27,100 | $2,500 | $24,600 |
| 2020 | $1,241 | $27,100 | $2,500 | $24,600 |
| 2019 | $1,241 | $27,100 | $2,500 | $24,600 |
| 2018 | $1,241 | $27,100 | $2,500 | $24,600 |
| 2017 | $1,339 | $25,525 | $3,000 | $22,525 |
| 2016 | $1,339 | $25,525 | $3,000 | $22,525 |
| 2015 | $1,339 | $25,525 | $3,000 | $22,525 |
| 2014 | $1,339 | $25,522 | $0 | $0 |
Source: Public Records
Map
Nearby Homes