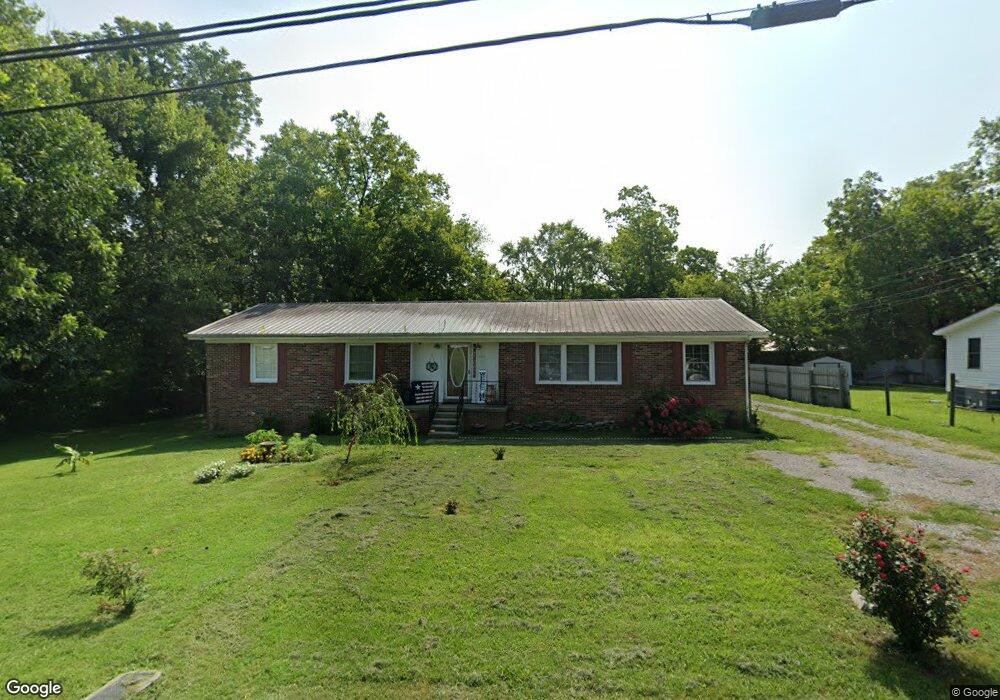
1006 Morton St Shelbyville, TN 37160
Estimated Value: $195,142 - $280,000
--
Bed
2
Baths
1,681
Sq Ft
$141/Sq Ft
Est. Value
About This Home
This home is located at 1006 Morton St, Shelbyville, TN 37160 and is currently estimated at $237,536, approximately $141 per square foot. 1006 Morton St is a home located in Bedford County with nearby schools including Eakin Elementary School, Harris Middle School, and Victory Baptist Academy.
Ownership History
Date
Name
Owned For
Owner Type
Purchase Details
Closed on
Jan 3, 2011
Sold by
Neese Wayne
Bought by
Smith Vachel R
Current Estimated Value
Home Financials for this Owner
Home Financials are based on the most recent Mortgage that was taken out on this home.
Original Mortgage
$72,500
Outstanding Balance
$48,529
Interest Rate
4.48%
Estimated Equity
$189,007
Purchase Details
Closed on
Apr 10, 2008
Sold by
Mitchell James R
Bought by
Neese Wayne
Purchase Details
Closed on
Aug 17, 1971
Bought by
Mitchell James R and Mitchell Marjorie
Create a Home Valuation Report for This Property
The Home Valuation Report is an in-depth analysis detailing your home's value as well as a comparison with similar homes in the area
Home Values in the Area
Average Home Value in this Area
Purchase History
| Date | Buyer | Sale Price | Title Company |
|---|---|---|---|
| Smith Vachel R | $72,500 | -- | |
| Neese Wayne | $38,501 | -- | |
| Mitchell James R | -- | -- |
Source: Public Records
Mortgage History
| Date | Status | Borrower | Loan Amount |
|---|---|---|---|
| Open | Smith Vachel R | $72,500 |
Source: Public Records
Tax History Compared to Growth
Tax History
| Year | Tax Paid | Tax Assessment Tax Assessment Total Assessment is a certain percentage of the fair market value that is determined by local assessors to be the total taxable value of land and additions on the property. | Land | Improvement |
|---|---|---|---|---|
| 2025 | -- | $31,150 | $0 | $0 |
| 2024 | -- | $31,150 | $4,125 | $27,025 |
| 2023 | $1,185 | $31,150 | $4,125 | $27,025 |
| 2022 | $1,219 | $31,150 | $4,125 | $27,025 |
| 2021 | $1,107 | $31,150 | $4,125 | $27,025 |
| 2020 | $906 | $31,150 | $4,125 | $27,025 |
| 2019 | $906 | $20,450 | $2,750 | $17,700 |
| 2018 | $886 | $20,450 | $2,750 | $17,700 |
| 2017 | $886 | $20,450 | $2,750 | $17,700 |
| 2016 | $877 | $20,450 | $2,750 | $17,700 |
| 2015 | $877 | $20,450 | $2,750 | $17,700 |
| 2014 | $814 | $20,775 | $0 | $0 |
Source: Public Records
Map
Nearby Homes
- 1000 Woodbury St
- 130 Horseshoe Dr
- 312 Cottonwood Dr
- 0 Hilltop Rd Unit RTC2897754
- 0 Hilltop Rd Unit RTC3001632
- 112 E Cedar St
- 102 Saddlewood Dr
- 703 Deery St
- 129 Annas Way
- 0 Archery Ln
- 115 Scotland Heights
- 329 Dover St
- 636 Deery St
- 1017 Fairfield Pike
- 402 Rose Ln
- 152 Demonbreum Cir
- 110 Demonbreum Cir
- 106 Demonbreum Cir
- 107 Demonbreum Cir
- 111 Demonbreum Cir