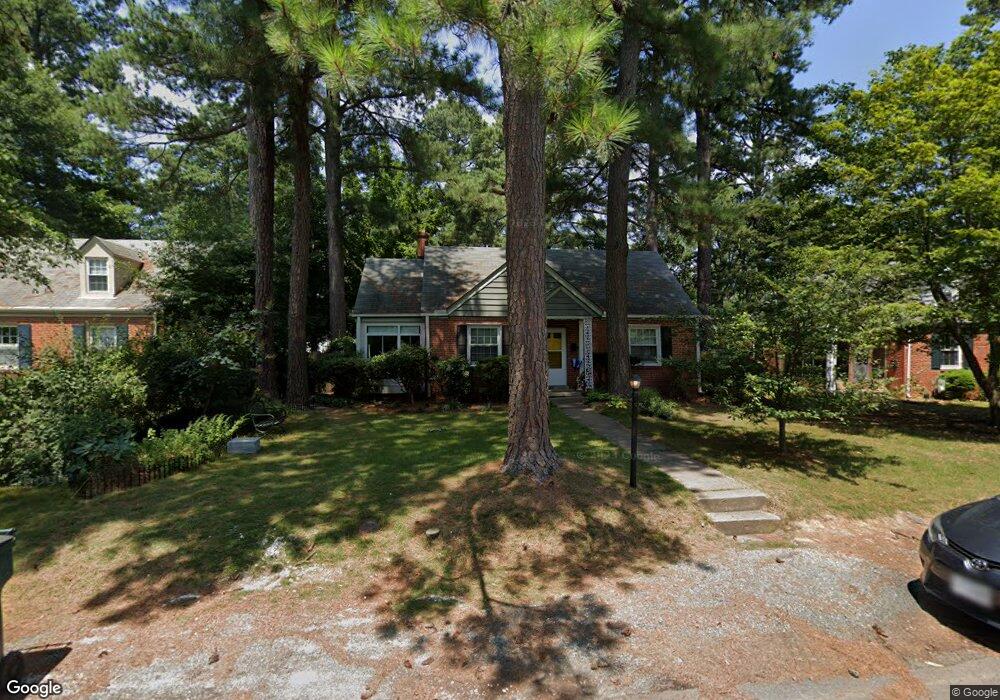
1006 Pepper Ave Richmond, VA 23226
Crestview NeighborhoodEstimated Value: $426,000 - $506,000
2
Beds
1
Bath
1,291
Sq Ft
$364/Sq Ft
Est. Value
About This Home
This home is located at 1006 Pepper Ave, Richmond, VA 23226 and is currently estimated at $469,959, approximately $364 per square foot. 1006 Pepper Ave is a home located in Henrico County with nearby schools including Crestview Elementary School, Tuckahoe Middle School, and Douglas S. Freeman High School.
Ownership History
Date
Name
Owned For
Owner Type
Purchase Details
Closed on
Jan 10, 2025
Sold by
Srour Dany and Stuart Kathleen Columbia
Bought by
Srour Dany and Stuart Kathleen Columbia
Current Estimated Value
Purchase Details
Closed on
May 18, 2023
Sold by
Madigan Elizabeth Lesley Ann
Bought by
Srour Dany and Stuart Kathleen Columbia
Home Financials for this Owner
Home Financials are based on the most recent Mortgage that was taken out on this home.
Original Mortgage
$387,845
Interest Rate
6.27%
Mortgage Type
FHA
Purchase Details
Closed on
Mar 31, 2006
Sold by
Bank Of America
Bought by
Madigan Elizabeth
Home Financials for this Owner
Home Financials are based on the most recent Mortgage that was taken out on this home.
Original Mortgage
$129,500
Interest Rate
6.26%
Mortgage Type
New Conventional
Create a Home Valuation Report for This Property
The Home Valuation Report is an in-depth analysis detailing your home's value as well as a comparison with similar homes in the area
Home Values in the Area
Average Home Value in this Area
Purchase History
| Date | Buyer | Sale Price | Title Company |
|---|---|---|---|
| Srour Dany | -- | None Listed On Document | |
| Srour Dany | $395,000 | Stewart Title Guaranty Company | |
| Madigan Elizabeth | $192,500 | -- |
Source: Public Records
Mortgage History
| Date | Status | Borrower | Loan Amount |
|---|---|---|---|
| Previous Owner | Srour Dany | $387,845 | |
| Previous Owner | Madigan Elizabeth | $129,500 |
Source: Public Records
Tax History
| Year | Tax Paid | Tax Assessment Tax Assessment Total Assessment is a certain percentage of the fair market value that is determined by local assessors to be the total taxable value of land and additions on the property. | Land | Improvement |
|---|---|---|---|---|
| 2025 | $3,376 | $370,700 | $105,000 | $265,700 |
| 2024 | $3,376 | $309,900 | $100,000 | $209,900 |
| 2023 | $2,634 | $309,900 | $100,000 | $209,900 |
| 2022 | $2,467 | $290,200 | $92,000 | $198,200 |
| 2021 | $2,158 | $220,900 | $72,000 | $148,900 |
| 2020 | $1,922 | $220,900 | $72,000 | $148,900 |
| 2019 | $1,835 | $210,900 | $64,000 | $146,900 |
| 2018 | $1,798 | $206,700 | $64,000 | $142,700 |
| 2017 | $1,684 | $193,600 | $56,000 | $137,600 |
| 2016 | $1,614 | $185,500 | $52,000 | $133,500 |
| 2015 | $1,502 | $174,200 | $52,000 | $122,200 |
| 2014 | $1,502 | $172,600 | $52,000 | $120,600 |
Source: Public Records
Map
Nearby Homes
- 905 Pine Ridge Rd
- 6213 Monument Ave
- 6421 W Grace St
- 6512 Kensington Ave
- 5923 Kensington Ave
- 1709 Betty Ln
- 6408 Crescent Pkwy
- 6725 Kensington Ave
- 606 Libbie Ave
- 5806 Guthrie Ave
- 5612 Wythe Ave
- 34 Old Mill Rd
- 5421 Park Ave
- 506.5 Westview Ave
- 512.5 Westview Ave
- 1400 Treboy Ave
- 31 Towana Rd
- 5304 Wythe Ave
- 6 Tapoan Rd
- 6205 Tapoan Place
- 1008 Pepper Ave
- 1004 Pepper Ave
- 1010 Pepper Ave
- 1002 Pepper Ave
- 1005 Orchard Rd
- 6225 Jeffrey Rd
- 1009 Orchard Rd
- 1012 Pepper Ave
- 1000 Pepper Ave
- 1003 Orchard Rd
- 1011 Orchard Rd
- 6224 Dustin Dr
- 6223 Jeffrey Rd
- 1001 Orchard Rd
- 1013 Orchard Rd
- 1014 Pepper Ave
- 6222 Dustin Dr
- 1015 Orchard Rd
- 920 Pepper Ave
- 6228 Jeffrey Rd
Your Personal Tour Guide
Ask me questions while you tour the home.