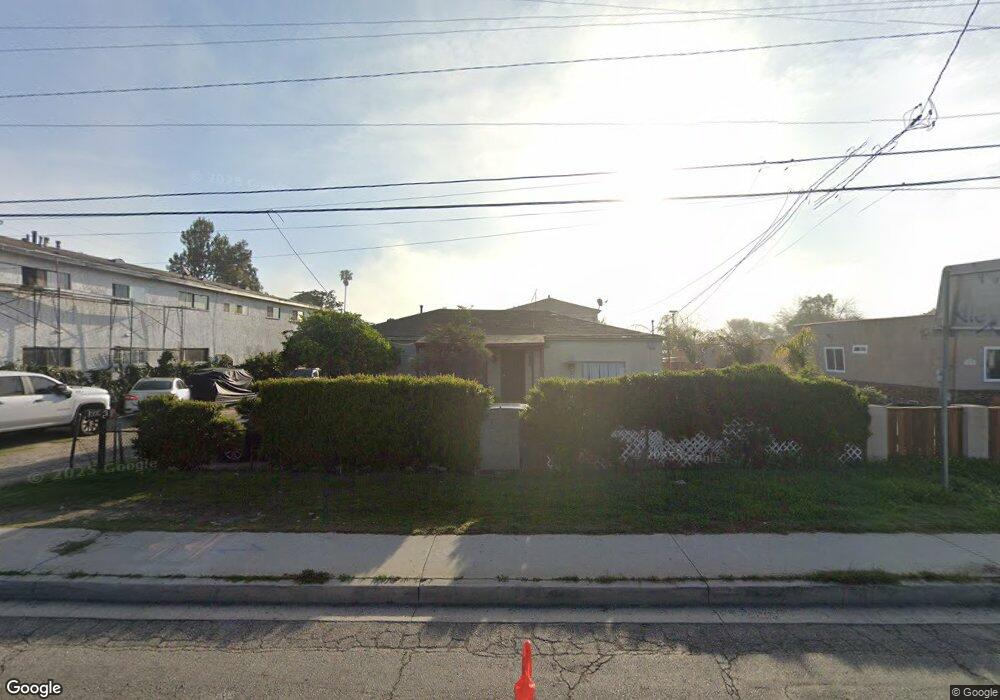
1006 S Wilmington Ave Compton, CA 90220
Estimated Value: $699,812 - $920,000
6
Beds
3
Baths
2,263
Sq Ft
$362/Sq Ft
Est. Value
About This Home
This home is located at 1006 S Wilmington Ave, Compton, CA 90220 and is currently estimated at $819,953, approximately $362 per square foot. 1006 S Wilmington Ave is a home located in Los Angeles County with nearby schools including Robert F. Kennedy Elementary School, Walton Middle School, and Compton High School.
Ownership History
Date
Name
Owned For
Owner Type
Purchase Details
Closed on
May 23, 2014
Sold by
Jimenez Jose J
Bought by
Jimenez Jose J and Jimenez Laura C
Current Estimated Value
Home Financials for this Owner
Home Financials are based on the most recent Mortgage that was taken out on this home.
Original Mortgage
$195,000
Outstanding Balance
$148,055
Interest Rate
4.23%
Mortgage Type
New Conventional
Estimated Equity
$671,898
Purchase Details
Closed on
Apr 15, 2003
Sold by
Jimenez Laura C
Bought by
Jimenez Jose J
Home Financials for this Owner
Home Financials are based on the most recent Mortgage that was taken out on this home.
Original Mortgage
$211,500
Interest Rate
5.54%
Purchase Details
Closed on
Mar 3, 1994
Sold by
Dixon Reginald R and Dixon Violet
Bought by
Jimenez Jose J
Home Financials for this Owner
Home Financials are based on the most recent Mortgage that was taken out on this home.
Original Mortgage
$168,354
Interest Rate
8.3%
Mortgage Type
FHA
Create a Home Valuation Report for This Property
The Home Valuation Report is an in-depth analysis detailing your home's value as well as a comparison with similar homes in the area
Home Values in the Area
Average Home Value in this Area
Purchase History
We collect this data history from publicly available records. To have your information removed, we recommend requesting removal directly through your county’s website.
| Date | Buyer | Sale Price | Title Company |
|---|---|---|---|
| Jimenez Jose J | -- | None Available | |
| Jimenez Jose J | -- | American Title Co | |
| Jimenez Jose J | $173,000 | -- |
Source: Public Records
Mortgage History
We collect this data history from publicly available records. To have your information removed, we recommend requesting removal directly through your county’s website.
| Date | Status | Borrower | Loan Amount |
|---|---|---|---|
| Open | Jimenez Jose J | $195,000 | |
| Closed | Jimenez Jose J | $211,500 | |
| Previous Owner | Jimenez Jose J | $168,354 |
Source: Public Records
Tax History
| Year | Tax Paid | Tax Assessment Tax Assessment Total Assessment is a certain percentage of the fair market value that is determined by local assessors to be the total taxable value of land and additions on the property. | Land | Improvement |
|---|---|---|---|---|
| 2025 | $6,739 | $294,014 | $124,059 | $169,955 |
| 2024 | $6,739 | $288,250 | $121,627 | $166,623 |
| 2023 | $6,628 | $282,599 | $119,243 | $163,356 |
| 2022 | $5,337 | $277,058 | $116,905 | $160,153 |
| 2021 | $5,374 | $271,626 | $114,613 | $157,013 |
| 2020 | $5,287 | $268,842 | $113,438 | $155,404 |
| 2019 | $5,227 | $263,571 | $111,214 | $152,357 |
| 2018 | $5,020 | $258,404 | $109,034 | $149,370 |
| 2016 | $4,771 | $248,372 | $104,801 | $143,571 |
| 2015 | $4,571 | $244,642 | $103,227 | $141,415 |
| 2014 | $4,504 | $239,850 | $101,205 | $138,645 |
Source: Public Records
Map
Nearby Homes
- 1118 S Exmoor Ave
- 1230 S Wilmington Ave
- 1222 S Kemp Ave
- 1201 S Grandee Ave
- 1423 S Whitemarsh Ave
- 1405 S Center Ave
- 1307 S Grandee Ave
- 623 W Indigo St
- 472 S Sherer Place
- 1313 S Broadacres Ave
- 700 W Almond St
- 1306 S Cliveden Ave
- 1022 W 156th St
- 420 W Tichenor St
- 456 W Bennett St
- 969 W Laurel St
- 938 S Tajauta Ave
- 508 W Laurel St
- 1037 S Tajauta Ave
- 524 W Almond St
- 1010 S Wilmington Ave
- 726 W Raymond St
- 1014 S Wilmington Ave
- 1006 S Whitemarsh Ave
- 1010 S Whitemarsh Ave
- 716 W Raymond St
- 1016 S Whitemarsh Ave
- 727 W Tichenor St
- 1018 S Whitemarsh Ave
- 712 W Raymond St
- 725 W Tichenor St
- 1022 S Whitemarsh Ave
- 711 W Raymond St
- 1007 S Whitemarsh Ave
- 1005 S Whitemarsh Ave
- 715 W Tichenor St
- 1011 S Whitemarsh Ave
- 1001 S Whitemarsh Ave
- 1015 S Whitemarsh Ave
- 709 W Raymond St
Your Personal Tour Guide
Ask me questions while you tour the home.