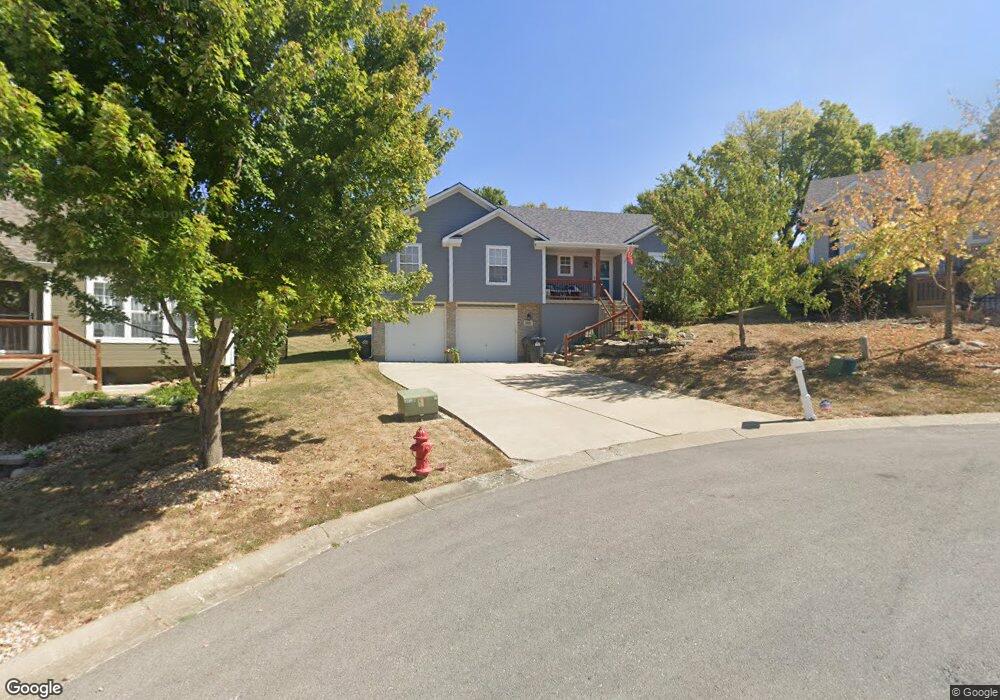
1006 SW Clover Ct Grain Valley, MO 64029
Estimated Value: $293,314 - $335,000
3
Beds
3
Baths
1,363
Sq Ft
$232/Sq Ft
Est. Value
About This Home
This home is located at 1006 SW Clover Ct, Grain Valley, MO 64029 and is currently estimated at $316,079, approximately $231 per square foot. 1006 SW Clover Ct is a home located in Jackson County with nearby schools including Grain Valley High School and Plaza Heights Christian Academy.
Ownership History
Date
Name
Owned For
Owner Type
Purchase Details
Closed on
Apr 28, 2008
Sold by
Bottorff Jerry and Bottorff Helen
Bought by
Vanzandt Sarah and Vanzandt James
Current Estimated Value
Home Financials for this Owner
Home Financials are based on the most recent Mortgage that was taken out on this home.
Original Mortgage
$171,197
Outstanding Balance
$107,709
Interest Rate
5.84%
Mortgage Type
FHA
Estimated Equity
$208,370
Purchase Details
Closed on
Jul 5, 2007
Sold by
Sallee Homes Inc
Bought by
Vanzandt Sarah and Bottorff Jerry
Purchase Details
Closed on
Jan 31, 2005
Sold by
Gorden Joel R
Bought by
Sallee Homes Inc
Purchase Details
Closed on
Mar 27, 2003
Sold by
Sallee/Homes Inc
Bought by
Gorden Joel R
Home Financials for this Owner
Home Financials are based on the most recent Mortgage that was taken out on this home.
Original Mortgage
$151,215
Interest Rate
5.83%
Mortgage Type
FHA
Create a Home Valuation Report for This Property
The Home Valuation Report is an in-depth analysis detailing your home's value as well as a comparison with similar homes in the area
Home Values in the Area
Average Home Value in this Area
Purchase History
| Date | Buyer | Sale Price | Title Company |
|---|---|---|---|
| Vanzandt Sarah | -- | Charter Land Title Llc | |
| Vanzandt Sarah | -- | Stewart Title Of Kansas City | |
| Sallee Homes Inc | -- | Stewart Title Of Ks City Inc | |
| Gorden Joel R | -- | -- |
Source: Public Records
Mortgage History
| Date | Status | Borrower | Loan Amount |
|---|---|---|---|
| Open | Vanzandt Sarah | $171,197 | |
| Previous Owner | Gorden Joel R | $151,215 |
Source: Public Records
Tax History Compared to Growth
Tax History
| Year | Tax Paid | Tax Assessment Tax Assessment Total Assessment is a certain percentage of the fair market value that is determined by local assessors to be the total taxable value of land and additions on the property. | Land | Improvement |
|---|---|---|---|---|
| 2025 | $3,576 | $48,746 | $8,466 | $40,280 |
| 2024 | $3,576 | $43,421 | $6,183 | $37,238 |
| 2023 | $3,443 | $43,421 | $5,814 | $37,607 |
| 2022 | $3,341 | $36,860 | $4,461 | $32,399 |
| 2021 | $3,263 | $36,860 | $4,461 | $32,399 |
| 2020 | $3,300 | $36,772 | $4,461 | $32,311 |
| 2019 | $3,233 | $36,772 | $4,461 | $32,311 |
| 2018 | $1,466,345 | $32,003 | $3,882 | $28,121 |
| 2017 | $2,809 | $32,003 | $3,882 | $28,121 |
| 2016 | $2,809 | $29,864 | $4,806 | $25,058 |
| 2014 | $2,775 | $29,279 | $4,712 | $24,567 |
Source: Public Records
Map
Nearby Homes
- 913 SW Abar Dr
- 714 SW Brome Dr
- 636 SW Lakeview Dr
- 1200 SW Foxtail Dr
- 1010 SW Cross Creek Dr
- 1203 SW Lakeview Dr
- 1219 SW Windcrest Ct
- 1214 SW Windcrest Ct
- 1215 SW Lone Star Ct
- 1309 SW Graystone Cir
- 725 SW Tisha Ln
- 640 SW Crestview Dr
- 509 SW Joseph Ct
- 801 SW Apple Grove Ct
- 719 S Minter Rd
- 621 SW Tisha Ln
- 115 E Old Us 40 Hwy N A
- 601 SW Nelson Dr
- 1024 Christie Ln
- 855 SW Ridgeview Dr
- 1008 SW Clover Ct
- 1004 SW Clover Ct
- 900 SW Abar Dr
- 1010 SW Clover Ct
- 1003 SW Ambush Ct
- 1005 SW Clover Ct
- 1005 SW Ambush Ct
- 902 SW Abar Dr
- 1007 SW Clover Ct
- 1001 SW Ambush Ct
- 1009 SW Clover Ct
- 1007 SW Ambush Ct
- 812 SW Shorthorn Dr
- 905 SW Abar Dr
- 1011 SW Clover Ct
- 810 SW Shorthorn Dr
- 904 SW Abar Dr
- 900 SW Shorthorn Dr
- 1000 SW Ambush Ct
- 740 SW Ginger Hill Dr