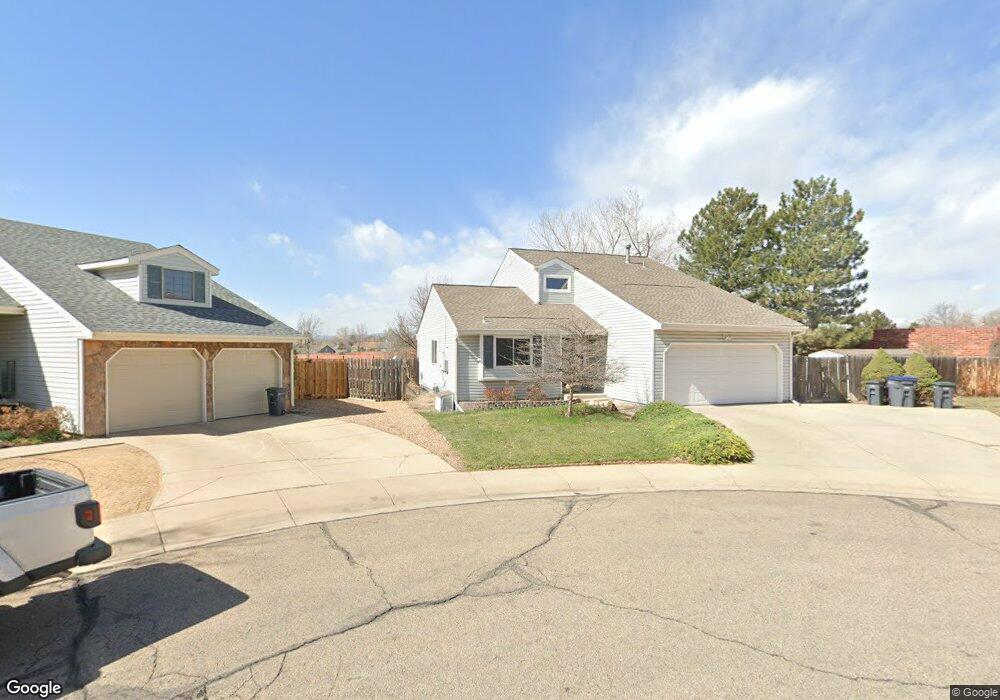
1006 W Cannon Place Lafayette, CO 80026
Estimated Value: $685,000 - $741,000
4
Beds
3
Baths
2,520
Sq Ft
$283/Sq Ft
Est. Value
About This Home
This home is located at 1006 W Cannon Place, Lafayette, CO 80026 and is currently estimated at $713,274, approximately $283 per square foot. 1006 W Cannon Place is a home located in Boulder County with nearby schools including Lafayette Elementary School, Angevine Middle School, and Centaurus High School.
Ownership History
Date
Name
Owned For
Owner Type
Purchase Details
Closed on
May 13, 2005
Sold by
Dill John R and Dill Lori Sue
Bought by
Kleiwerda Christine
Current Estimated Value
Home Financials for this Owner
Home Financials are based on the most recent Mortgage that was taken out on this home.
Original Mortgage
$224,000
Outstanding Balance
$118,217
Interest Rate
6.03%
Mortgage Type
New Conventional
Estimated Equity
$595,057
Purchase Details
Closed on
Jun 14, 1996
Sold by
Johnson Graham A
Bought by
Dill John R
Purchase Details
Closed on
Jul 27, 1992
Bought by
Kleiwerda Christine and Kleiwerda George Otteni
Purchase Details
Closed on
Jul 30, 1991
Bought by
Kleiwerda Christine and Kleiwerda George Otteni
Purchase Details
Closed on
Oct 2, 1989
Bought by
Kleiwerda Christine and Kleiwerda George Otteni
Create a Home Valuation Report for This Property
The Home Valuation Report is an in-depth analysis detailing your home's value as well as a comparison with similar homes in the area
Home Values in the Area
Average Home Value in this Area
Purchase History
| Date | Buyer | Sale Price | Title Company |
|---|---|---|---|
| Kleiwerda Christine | $280,000 | Fahtco | |
| Dill John R | $147,500 | -- | |
| Kleiwerda Christine | $117,500 | -- | |
| Kleiwerda Christine | $102,500 | -- | |
| Kleiwerda Christine | $95,500 | -- |
Source: Public Records
Mortgage History
| Date | Status | Borrower | Loan Amount |
|---|---|---|---|
| Open | Kleiwerda Christine | $224,000 | |
| Closed | Kleiwerda Christine | $28,000 |
Source: Public Records
Tax History Compared to Growth
Tax History
| Year | Tax Paid | Tax Assessment Tax Assessment Total Assessment is a certain percentage of the fair market value that is determined by local assessors to be the total taxable value of land and additions on the property. | Land | Improvement |
|---|---|---|---|---|
| 2025 | $3,889 | $42,938 | $11,550 | $31,388 |
| 2024 | $3,889 | $42,938 | $11,550 | $31,388 |
| 2023 | $3,822 | $43,885 | $14,861 | $32,709 |
| 2022 | $3,167 | $33,715 | $10,439 | $23,276 |
| 2021 | $3,132 | $34,684 | $10,739 | $23,945 |
| 2020 | $2,941 | $32,175 | $9,152 | $23,023 |
| 2019 | $2,900 | $32,175 | $9,152 | $23,023 |
| 2018 | $2,715 | $29,743 | $7,920 | $21,823 |
| 2017 | $2,644 | $32,883 | $8,756 | $24,127 |
| 2016 | $2,206 | $24,024 | $6,846 | $17,178 |
| 2015 | $2,067 | $19,335 | $5,572 | $13,763 |
| 2014 | $1,672 | $19,335 | $5,572 | $13,763 |
Source: Public Records
Map
Nearby Homes
- 490 E Sutton Cir
- 1140 Dorset Ct
- 1125 Somerset St
- 372 S Carr Ave
- 1140 Devonshire Ct
- 1160 Devonshire Ct
- 655 N Gooseberry Ct
- 718 Julian Cir
- 200 S Carr Ave
- 880 Orion Dr
- 725 Julian Cir
- 925 Sparta Dr
- 1376 Lambert Cir
- 805 Argos Cir
- 911 Homer Cir
- 403 W Cannon St
- 924 Milo Cir Unit A
- 998 Milo Cir Unit A
- 1091 Milo Cir Unit B
- 736 Gateway Cir
- 1004 W Cannon Place
- 1007 W Cannon Place
- 1005 Sunburst Ct
- 1002 W Cannon Place
- 1005 W Cannon Place
- 1007 Sunburst Ct
- 1003 W Cannon Place
- 1003 Sunburst Ct
- 1000 W Cannon Place
- 1004 Willow Place
- 1001 W Cannon Place
- 1001 Sunburst Ct
- 1006 Willow Place
- 1006 Sunburst Ct
- 1002 Willow Place
- 1004 Sunburst Ct
- 1000 Willow Place
- 1002 Sunburst Ct
- 380 W Sutton Cir
- 1000 Sunburst Ct