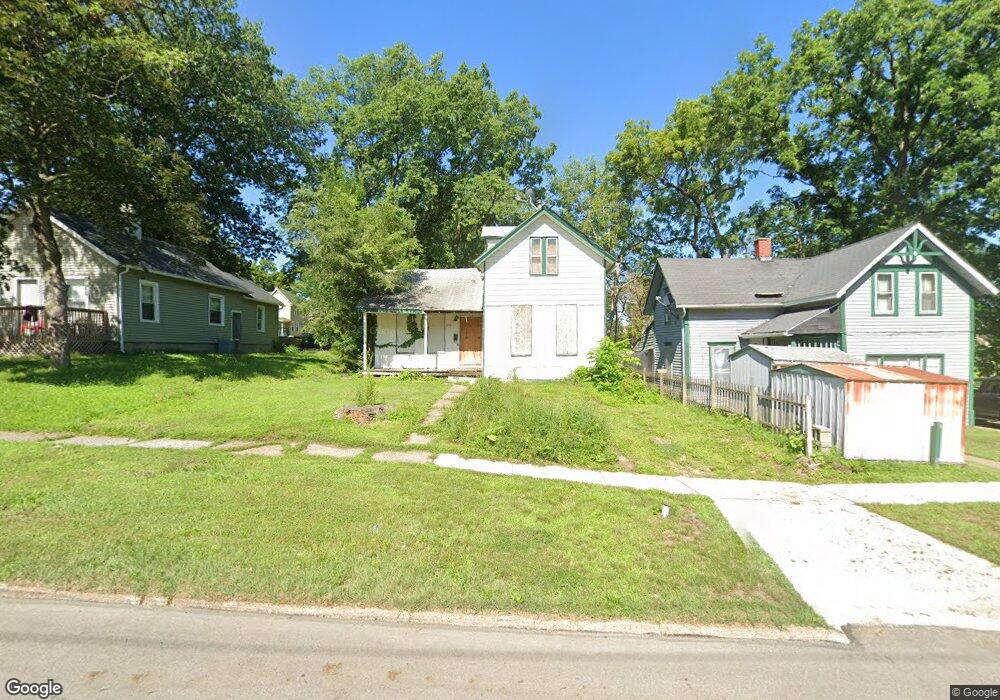
1006 Warren St Davenport, IA 52804
Central Davenport NeighborhoodEstimated Value: $53,000 - $127,000
3
Beds
1
Bath
1,181
Sq Ft
$73/Sq Ft
Est. Value
About This Home
This home is located at 1006 Warren St, Davenport, IA 52804 and is currently estimated at $86,562, approximately $73 per square foot. 1006 Warren St is a home located in Scott County with nearby schools including Walnut Hill Elementary School, Christian County Middle School, and Casey County Middle School.
Ownership History
Date
Name
Owned For
Owner Type
Purchase Details
Closed on
Sep 28, 2009
Sold by
Forzese Kevin Scott and Forzese Erica
Bought by
Whittemore Lora
Current Estimated Value
Home Financials for this Owner
Home Financials are based on the most recent Mortgage that was taken out on this home.
Original Mortgage
$26,500
Outstanding Balance
$17,251
Interest Rate
5.1%
Mortgage Type
Future Advance Clause Open End Mortgage
Estimated Equity
$69,311
Purchase Details
Closed on
Oct 8, 2008
Sold by
Hud
Bought by
Forzese Kevin Scott
Purchase Details
Closed on
Oct 12, 2007
Sold by
Wells Fargo Bank Na
Bought by
Secretary Of Hud
Purchase Details
Closed on
May 16, 2007
Sold by
Hiaddon Akimisan
Bought by
Wells Fargo Bank Na
Create a Home Valuation Report for This Property
The Home Valuation Report is an in-depth analysis detailing your home's value as well as a comparison with similar homes in the area
Home Values in the Area
Average Home Value in this Area
Purchase History
| Date | Buyer | Sale Price | Title Company |
|---|---|---|---|
| Whittemore Lora | $33,000 | None Available | |
| Forzese Kevin Scott | -- | None Available | |
| Secretary Of Hud | $47,500 | None Available | |
| Wells Fargo Bank Na | $47,259 | None Available |
Source: Public Records
Mortgage History
| Date | Status | Borrower | Loan Amount |
|---|---|---|---|
| Open | Whittemore Lora | $26,500 |
Source: Public Records
Tax History Compared to Growth
Tax History
| Year | Tax Paid | Tax Assessment Tax Assessment Total Assessment is a certain percentage of the fair market value that is determined by local assessors to be the total taxable value of land and additions on the property. | Land | Improvement |
|---|---|---|---|---|
| 2025 | -- | $40,550 | $8,780 | $31,770 |
| 2024 | -- | $44,890 | $0 | $0 |
| 2023 | -- | $44,890 | $0 | $0 |
| 2022 | $0 | $33,650 | $0 | $0 |
| 2021 | $0 | $33,650 | $0 | $0 |
| 2020 | $839 | $29,800 | $0 | $0 |
| 2019 | $897 | $29,800 | $4,880 | $24,920 |
| 2018 | $816 | $29,800 | $4,880 | $24,920 |
| 2017 | $636 | $29,800 | $4,880 | $24,920 |
| 2016 | $1,054 | $28,000 | $0 | $0 |
| 2015 | $637 | $37,390 | $0 | $0 |
| 2014 | $830 | $37,650 | $0 | $0 |
| 2013 | $822 | $0 | $0 | $0 |
| 2012 | -- | $41,490 | $6,720 | $34,770 |
Source: Public Records
Map
Nearby Homes