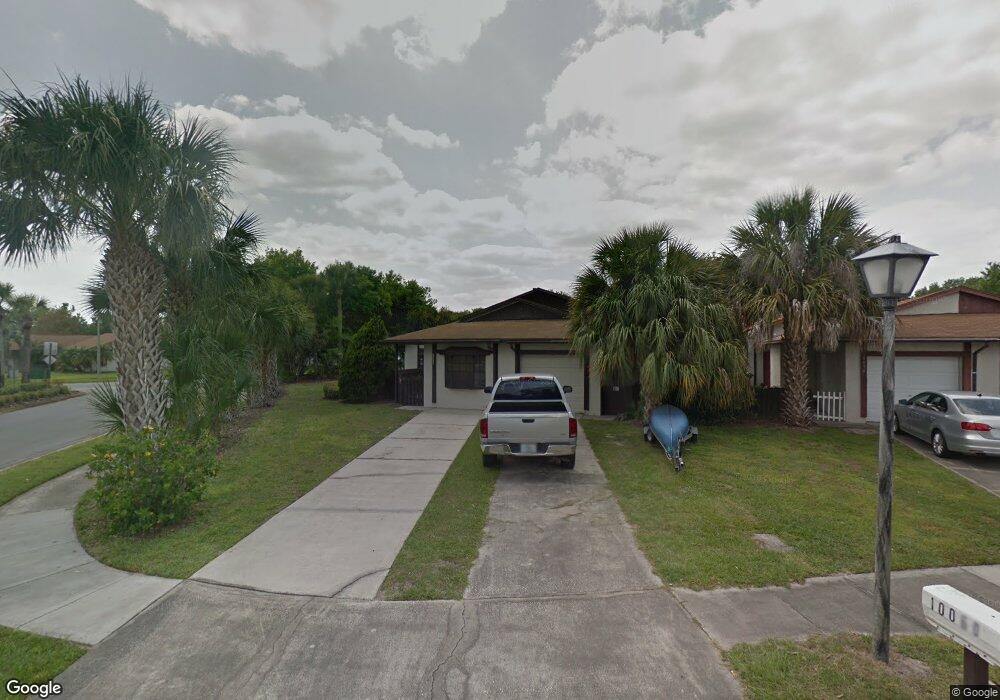
10066 Bynum Ct Orlando, FL 32821
Williamsburg NeighborhoodEstimated Value: $237,000 - $271,000
2
Beds
2
Baths
1,550
Sq Ft
$163/Sq Ft
Est. Value
About This Home
This home is located at 10066 Bynum Ct, Orlando, FL 32821 and is currently estimated at $252,196, approximately $162 per square foot. 10066 Bynum Ct is a home located in Orange County with nearby schools including Freedom Middle School, Orlando Torah Academy, and Starchild Academy.
Ownership History
Date
Name
Owned For
Owner Type
Purchase Details
Closed on
Jan 31, 2022
Sold by
David Ruppell Revocable Trust
Bought by
Hurtubise Debra L
Current Estimated Value
Home Financials for this Owner
Home Financials are based on the most recent Mortgage that was taken out on this home.
Original Mortgage
$204,250
Outstanding Balance
$189,662
Interest Rate
3.55%
Mortgage Type
New Conventional
Estimated Equity
$62,534
Purchase Details
Closed on
Sep 11, 2018
Sold by
Ruppell David C
Bought by
Ruppell David and Ruppell Joyce
Purchase Details
Closed on
Oct 1, 2015
Sold by
Comella Peter N S and Ferrara Donato J
Bought by
Comella Ferrara Family Trust and Ferrara Donato J
Purchase Details
Closed on
Dec 12, 2003
Sold by
Worthen Michael E
Bought by
Parcell James and Parcell Barbara
Purchase Details
Closed on
Apr 5, 2002
Sold by
John P Charland I
Bought by
Ruppell David C and Tousignant Albert
Create a Home Valuation Report for This Property
The Home Valuation Report is an in-depth analysis detailing your home's value as well as a comparison with similar homes in the area
Home Values in the Area
Average Home Value in this Area
Purchase History
| Date | Buyer | Sale Price | Title Company |
|---|---|---|---|
| Hurtubise Debra L | $215,000 | None Listed On Document | |
| Ruppell David | -- | Attorney | |
| Comella Ferrara Family Trust | -- | None Available | |
| Parcell James | $20,000 | -- | |
| Ruppell David C | $10,500 | -- |
Source: Public Records
Mortgage History
| Date | Status | Borrower | Loan Amount |
|---|---|---|---|
| Open | Hurtubise Debra L | $204,250 |
Source: Public Records
Tax History Compared to Growth
Tax History
| Year | Tax Paid | Tax Assessment Tax Assessment Total Assessment is a certain percentage of the fair market value that is determined by local assessors to be the total taxable value of land and additions on the property. | Land | Improvement |
|---|---|---|---|---|
| 2025 | $2,828 | $196,068 | -- | -- |
| 2024 | $2,634 | $196,068 | -- | -- |
| 2023 | $2,634 | $184,992 | $45,000 | $139,992 |
| 2022 | $2,683 | $171,396 | $45,000 | $126,396 |
| 2021 | $2,448 | $146,969 | $35,000 | $111,969 |
| 2020 | $2,273 | $148,762 | $35,000 | $113,762 |
| 2019 | $2,271 | $144,808 | $30,000 | $114,808 |
| 2018 | $2,191 | $141,991 | $30,000 | $111,991 |
| 2017 | $2,098 | $139,243 | $30,000 | $109,243 |
| 2016 | $1,842 | $112,117 | $15,000 | $97,117 |
| 2015 | $1,672 | $93,525 | $12,000 | $81,525 |
| 2014 | $1,566 | $80,922 | $12,000 | $68,922 |
Source: Public Records
Map
Nearby Homes
- 4720 Gardenbrook Ln
- 10305 Licorice Way
- 10230 Genesee Ln
- 10401 Larissa St
- 4000 Breakview Dr Unit C207
- 5016 Loyola Ln
- 4013 Breakview Dr Unit A407
- 10616 Leafy Way
- 4024 Breakview Dr Unit 402
- 4024 Breakview Dr Unit 10404
- 4102 Breakview Dr Unit 30603
- 4102 Breakview Dr Unit 40803
- 4114 Breakview Dr Unit 406
- 4114 Breakview Dr Unit 40402
- 4114 Breakview Dr Unit 401
- 4114 Breakview Dr Unit 30702
- 4114 Breakview Dr Unit 30402
- 4870 Watervista Dr
- 5120 Lazy Lake Cir
- 4126 Breakview Dr Unit 40901
- 10060 Bynum Ct
- 10054 Bynum Ct
- 10048 Bynum Ct
- 10042 Bynum Ct
- 10102 Blazed Tree Ct
- 10019 Grendon Ln
- 10036 Bynum Ct
- 10105 Gifford Blvd
- 10104 Gifford Blvd
- 10108 Blazed Tree Ct
- 10013 Grendon Ln
- 10030 Bynum Ct
- 10114 Blazed Tree Ct
- 4702 Gifford Blvd
- 10120 Blazed Tree Ct
- 10055 Bynum Ct
- 10024 Bynum Ct
- 10126 Blazed Tree Ct
- 10049 Bynum Ct
- 10018 Bynum Ct