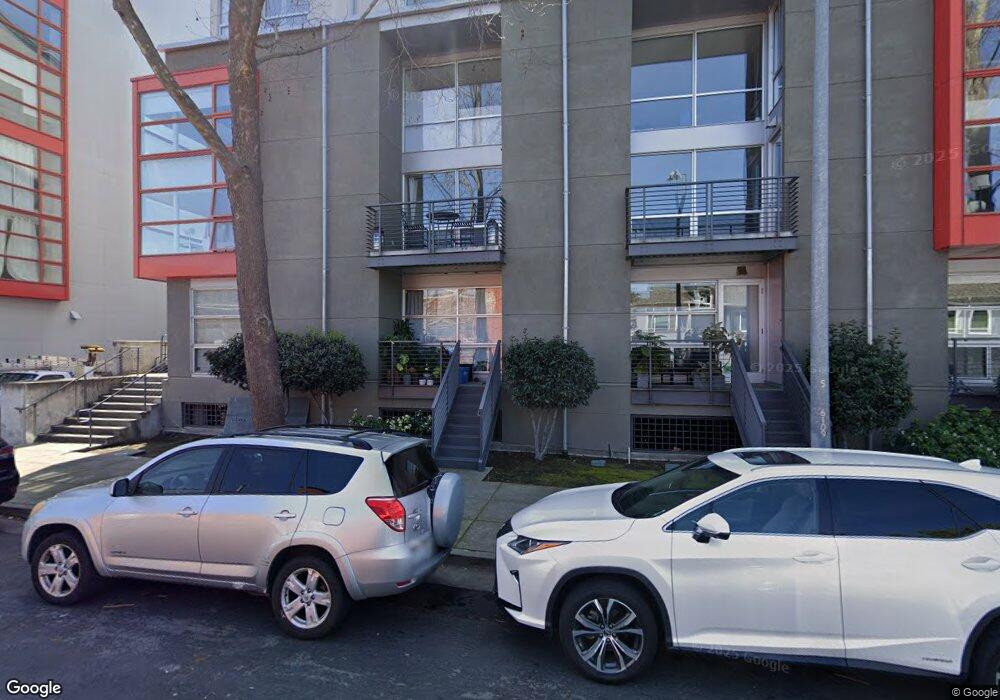
GreenCity Lofts 1007 41st St Unit 214 Emeryville, CA 94608
Longfellow NeighborhoodEstimated Value: $362,000 - $425,000
1
Bed
1
Bath
767
Sq Ft
$510/Sq Ft
Est. Value
About This Home
This home is located at 1007 41st St Unit 214, Emeryville, CA 94608 and is currently estimated at $391,238, approximately $510 per square foot. 1007 41st St Unit 214 is a home located in Alameda County with nearby schools including Emerson Elementary School, Westlake Middle School, and Oakland Technical High School.
Ownership History
Date
Name
Owned For
Owner Type
Purchase Details
Closed on
Oct 30, 2017
Sold by
Tang Winny
Bought by
Tang Winny
Current Estimated Value
Purchase Details
Closed on
Sep 22, 2016
Sold by
Smith Russell E and Smith Rusell E
Bought by
Tang Winny
Home Financials for this Owner
Home Financials are based on the most recent Mortgage that was taken out on this home.
Original Mortgage
$230,200
Outstanding Balance
$183,875
Interest Rate
3.43%
Mortgage Type
New Conventional
Estimated Equity
$207,363
Purchase Details
Closed on
Sep 20, 2006
Sold by
Greencity Lofts Llc
Bought by
Smith Russell E
Home Financials for this Owner
Home Financials are based on the most recent Mortgage that was taken out on this home.
Original Mortgage
$98,320
Interest Rate
6.43%
Mortgage Type
Purchase Money Mortgage
Create a Home Valuation Report for This Property
The Home Valuation Report is an in-depth analysis detailing your home's value as well as a comparison with similar homes in the area
Home Values in the Area
Average Home Value in this Area
Purchase History
| Date | Buyer | Sale Price | Title Company |
|---|---|---|---|
| Tang Winny | -- | None Available | |
| Tang Winny | $288,000 | Old Republic Title Company | |
| Smith Russell E | $256,000 | Old Republic Title Company |
Source: Public Records
Mortgage History
| Date | Status | Borrower | Loan Amount |
|---|---|---|---|
| Open | Tang Winny | $230,200 | |
| Previous Owner | Smith Russell E | $98,320 |
Source: Public Records
Tax History Compared to Growth
Tax History
| Year | Tax Paid | Tax Assessment Tax Assessment Total Assessment is a certain percentage of the fair market value that is determined by local assessors to be the total taxable value of land and additions on the property. | Land | Improvement |
|---|---|---|---|---|
| 2025 | $4,442 | $327,008 | $100,156 | $233,852 |
| 2024 | $4,442 | $320,461 | $98,193 | $229,268 |
| 2023 | $4,441 | $321,040 | $96,267 | $224,773 |
| 2022 | $4,160 | $307,746 | $94,380 | $220,366 |
| 2021 | $4,045 | $301,575 | $92,529 | $216,046 |
| 2020 | $4,057 | $305,412 | $91,581 | $213,831 |
| 2019 | $3,945 | $299,426 | $89,786 | $209,640 |
| 2018 | $3,744 | $293,556 | $88,026 | $205,530 |
| 2017 | $3,778 | $287,800 | $86,300 | $201,500 |
| 2016 | $3,699 | $289,722 | $86,916 | $202,806 |
| 2015 | $3,269 | $250,000 | $75,000 | $175,000 |
| 2014 | $2,388 | $178,000 | $53,400 | $124,600 |
Source: Public Records
About GreenCity Lofts
Map
Nearby Homes
- 1007 41st St Unit 334
- 4240 Adeline St
- 985 41st St Unit 140
- 3960 Adeline St Unit 303
- 942 41st St
- 1121 40th St Unit 3103
- 1121 40th St Unit 4105
- 1121 40th St Unit 2406
- 1121 40th St Unit 4201
- 1121 40th St Unit 3307
- 933 41st St
- 4320 Adeline St
- 906 40th St
- 1001 46th St Unit 220A
- 1001 46th St Unit 503
- 1001 46th St Unit 508A
- 3801 San Pablo Ave Unit 312
- 863 40th St
- 1007 47th St
- 883 46th St
- 1007 41st St
- 1007 41st St
- 1007 41st St Unit 233
- 1007 41st St Unit 232
- 1007 41st St Unit 231
- 1007 41st St Unit 224
- 1007 41st St Unit 223
- 1007 41st St Unit 222
- 1007 41st St Unit 221
- 1007 41st St Unit 213
- 1007 41st St Unit 212
- 1007 41st St Unit 211
- 1007 41st St Unit 133
- 1007 41st St Unit 132
- 1007 41st St Unit 131
- 1007 41st St Unit 124
- 1007 41st St Unit 123
- 1007 41st St Unit 442
- 1007 41st St Unit 441
- 1007 41st St Unit 434