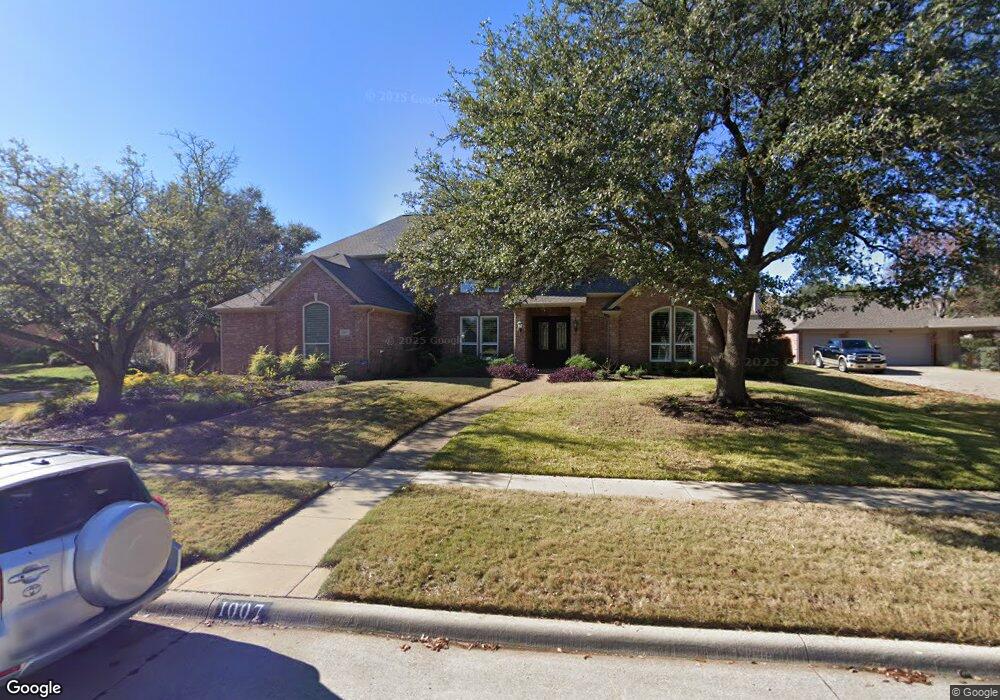
1007 Normandy Dr Southlake, TX 76092
Estimated Value: $1,032,000 - $1,274,000
4
Beds
4
Baths
4,330
Sq Ft
$267/Sq Ft
Est. Value
About This Home
This home is located at 1007 Normandy Dr, Southlake, TX 76092 and is currently estimated at $1,155,419, approximately $266 per square foot. 1007 Normandy Dr is a home located in Tarrant County with nearby schools including Carroll Elementary School, Eubanks Intermediate School, and George Dawson Middle School.
Ownership History
Date
Name
Owned For
Owner Type
Purchase Details
Closed on
Jul 14, 1998
Sold by
Hugues Charles A and Hugues Judith E
Bought by
Lash Robert J and Lash Jane Brendel
Current Estimated Value
Purchase Details
Closed on
Aug 8, 1995
Sold by
Weekley Homes Inc
Bought by
Hugues Charles A and Hugues Judith E
Home Financials for this Owner
Home Financials are based on the most recent Mortgage that was taken out on this home.
Original Mortgage
$150,000
Interest Rate
7.54%
Purchase Details
Closed on
Mar 15, 1995
Sold by
Southlake Properties Joint Venture
Bought by
Weekley Homes Inc
Home Financials for this Owner
Home Financials are based on the most recent Mortgage that was taken out on this home.
Original Mortgage
$20,000,000
Interest Rate
8.86%
Create a Home Valuation Report for This Property
The Home Valuation Report is an in-depth analysis detailing your home's value as well as a comparison with similar homes in the area
Home Values in the Area
Average Home Value in this Area
Purchase History
| Date | Buyer | Sale Price | Title Company |
|---|---|---|---|
| Lash Robert J | -- | Lone Star Title | |
| Hugues Charles A | -- | Stewart Title | |
| Weekley Homes Inc | -- | Stewart Title |
Source: Public Records
Mortgage History
| Date | Status | Borrower | Loan Amount |
|---|---|---|---|
| Previous Owner | Hugues Charles A | $150,000 | |
| Previous Owner | Weekley Homes Inc | $20,000,000 |
Source: Public Records
Tax History Compared to Growth
Tax History
| Year | Tax Paid | Tax Assessment Tax Assessment Total Assessment is a certain percentage of the fair market value that is determined by local assessors to be the total taxable value of land and additions on the property. | Land | Improvement |
|---|---|---|---|---|
| 2025 | $13,701 | $934,839 | $323,700 | $611,139 |
| 2024 | $13,701 | $973,791 | $323,700 | $650,091 |
| 2023 | $15,064 | $1,026,000 | $323,700 | $702,300 |
| 2022 | $16,209 | $933,120 | $215,800 | $717,320 |
| 2021 | $15,573 | $683,030 | $215,800 | $467,230 |
| 2020 | $15,410 | $670,421 | $194,220 | $476,201 |
| 2019 | $15,861 | $655,000 | $150,000 | $505,000 |
| 2018 | $13,648 | $600,000 | $125,000 | $475,000 |
| 2017 | $14,681 | $592,323 | $110,000 | $482,323 |
| 2016 | $14,526 | $586,033 | $110,000 | $476,033 |
| 2015 | $12,985 | $549,907 | $90,000 | $459,907 |
| 2014 | $12,985 | $537,000 | $55,000 | $482,000 |
Source: Public Records
Map
Nearby Homes
- 305 Sheffield Dr
- 203 Manor Place
- 608 Stratford Dr
- 806 Ridgedale Ct
- 806 Shadow Glen Dr
- 800 Woodcrest Ct
- 102 Springbrook Ct
- 204 Southridge Lakes Pkwy
- 305 Canyon Lake Dr
- 300 Shady Oaks Dr
- 2530 & 2580 W Southlake Blvd
- 203 Donley Ct
- 403 Presidio Ct
- 205 Edinburgh Ct
- 690 S Peytonville Ave
- 503 Indian Paintbrush Way
- 1002 Chimney Hill Trail
- 802 Princeton Ct
- 207 Killdeer Trail
- 710 Deer Hollow Blvd
- 1005 Normandy Dr
- 1101 Normandy Dr
- 309 Sheffield Dr
- 311 Sheffield Dr
- 1003 Normandy Dr
- 700 Dover Place
- 1103 Normandy Dr
- 708 Dover Place
- 307 Sheffield Dr
- 313 Sheffield Dr
- 1006 Normandy Dr
- 708 Essex Ct
- 702 Dover Place
- 706 Dover Place
- 1105 Normandy Dr
- 704 Dover Place
- 1004 Normandy Dr
- 310 Sheffield Dr
- 1002 Normandy Dr
- 1107 Normandy Dr