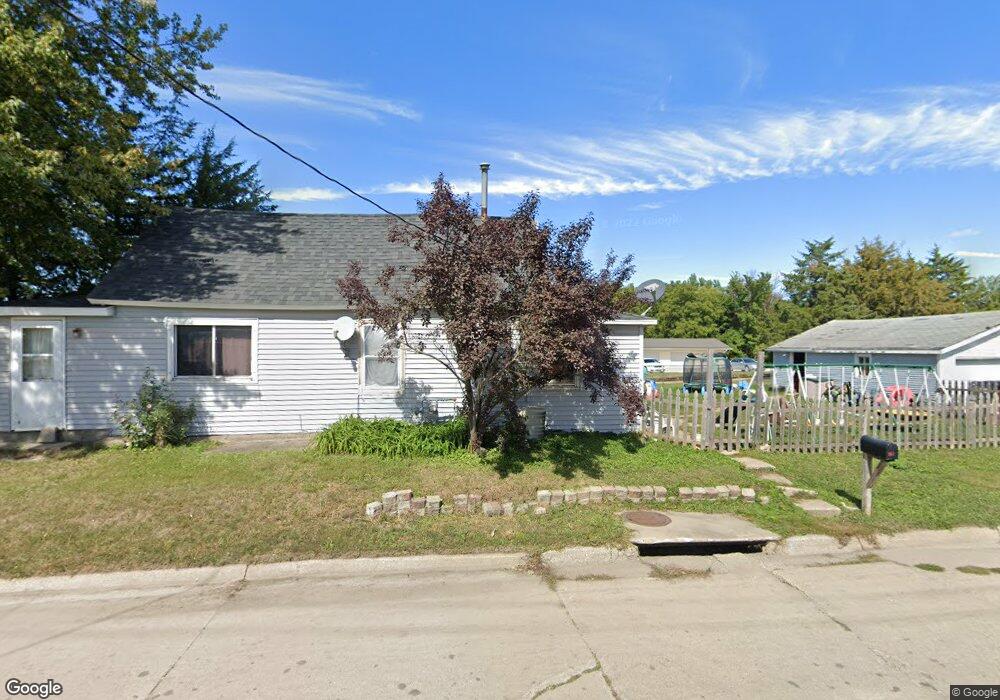
1007 W 8th St Vinton, IA 52349
Estimated Value: $52,000 - $166,000
2
Beds
1
Bath
1,012
Sq Ft
$84/Sq Ft
Est. Value
About This Home
This home is located at 1007 W 8th St, Vinton, IA 52349 and is currently estimated at $85,125, approximately $84 per square foot. 1007 W 8th St is a home located in Benton County with nearby schools including Tilford Elementary School, Shellsburg Elementary School, and Vinton-Shellsburg Middle School.
Ownership History
Date
Name
Owned For
Owner Type
Purchase Details
Closed on
Mar 21, 2025
Sold by
Schminke Brian O and Schminke Denise A
Bought by
Wheeler Toby and Wilkinson Cheyenne
Current Estimated Value
Purchase Details
Closed on
Mar 20, 2007
Sold by
Mtglq Investors Lp
Bought by
Schminke Brian O and Schminke Denise A
Home Financials for this Owner
Home Financials are based on the most recent Mortgage that was taken out on this home.
Original Mortgage
$17,200
Interest Rate
6.27%
Mortgage Type
Future Advance Clause Open End Mortgage
Create a Home Valuation Report for This Property
The Home Valuation Report is an in-depth analysis detailing your home's value as well as a comparison with similar homes in the area
Home Values in the Area
Average Home Value in this Area
Purchase History
| Date | Buyer | Sale Price | Title Company |
|---|---|---|---|
| Wheeler Toby | $42,500 | None Listed On Document | |
| Schminke Brian O | $215,000 | None Available |
Source: Public Records
Mortgage History
| Date | Status | Borrower | Loan Amount |
|---|---|---|---|
| Previous Owner | Schminke Brian O | $17,200 |
Source: Public Records
Tax History Compared to Growth
Tax History
| Year | Tax Paid | Tax Assessment Tax Assessment Total Assessment is a certain percentage of the fair market value that is determined by local assessors to be the total taxable value of land and additions on the property. | Land | Improvement |
|---|---|---|---|---|
| 2025 | $742 | $54,700 | $10,100 | $44,600 |
| 2024 | $722 | $49,800 | $9,900 | $39,900 |
| 2023 | $676 | $49,800 | $9,900 | $39,900 |
| 2022 | $692 | $40,300 | $7,900 | $32,400 |
| 2021 | $692 | $40,300 | $7,900 | $32,400 |
| 2020 | $600 | $36,500 | $11,300 | $25,200 |
| 2019 | $722 | $36,500 | $11,300 | $25,200 |
| 2018 | $884 | $41,500 | $10,700 | $30,800 |
| 2017 | $852 | $41,500 | $10,700 | $30,800 |
| 2016 | $838 | $0 | $0 | $0 |
| 2015 | $838 | $38,800 | $10,000 | $28,800 |
| 2014 | $846 | $39,100 | $0 | $0 |
Source: Public Records
Map
Nearby Homes