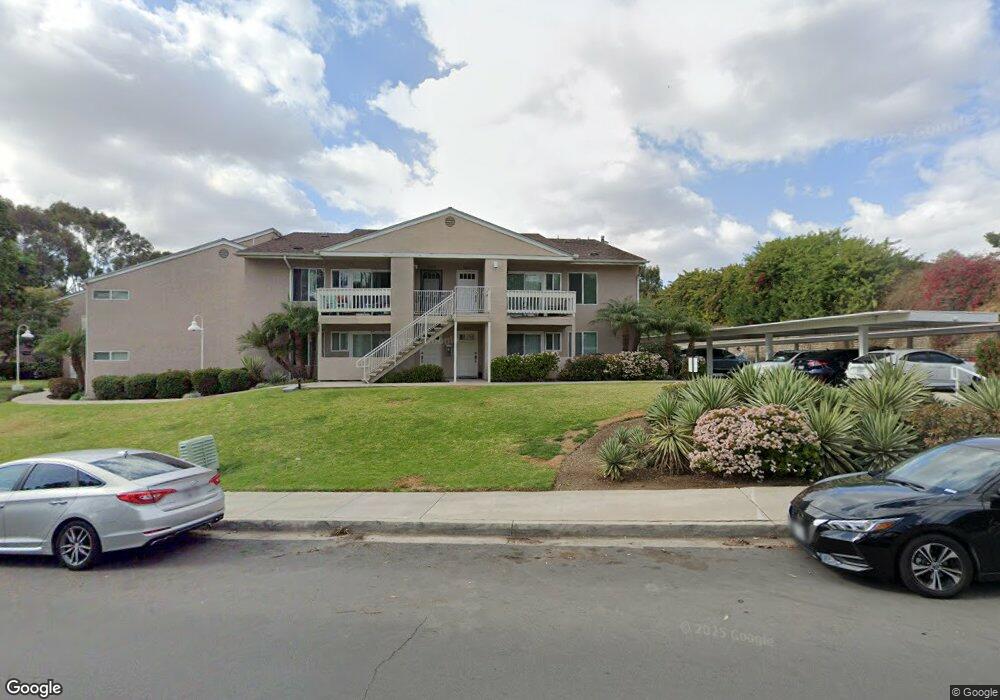
10076 Maya Linda Rd Unit 1206 San Diego, CA 92126
Mira Mesa NeighborhoodEstimated Value: $520,869 - $690,000
2
Beds
2
Baths
956
Sq Ft
$612/Sq Ft
Est. Value
About This Home
This home is located at 10076 Maya Linda Rd Unit 1206, San Diego, CA 92126 and is currently estimated at $585,467, approximately $612 per square foot. 10076 Maya Linda Rd Unit 1206 is a home located in San Diego County with nearby schools including Walker Elementary School, Wangenheim Middle School, and Mira Mesa High School.
Ownership History
Date
Name
Owned For
Owner Type
Purchase Details
Closed on
Feb 22, 2010
Sold by
Federal National Mortgage Association
Bought by
Fang Da Guo and Hu Bao C
Current Estimated Value
Home Financials for this Owner
Home Financials are based on the most recent Mortgage that was taken out on this home.
Original Mortgage
$150,000
Outstanding Balance
$99,275
Interest Rate
5.03%
Mortgage Type
New Conventional
Estimated Equity
$486,192
Purchase Details
Closed on
Sep 24, 2009
Sold by
Pearl Alexander J I
Bought by
Federal National Mortgage Association
Purchase Details
Closed on
Aug 28, 2006
Sold by
10006 Maya Linda Llc
Bought by
Pearl Alexander J I
Home Financials for this Owner
Home Financials are based on the most recent Mortgage that was taken out on this home.
Original Mortgage
$66,980
Interest Rate
6.51%
Mortgage Type
Credit Line Revolving
Create a Home Valuation Report for This Property
The Home Valuation Report is an in-depth analysis detailing your home's value as well as a comparison with similar homes in the area
Home Values in the Area
Average Home Value in this Area
Purchase History
| Date | Buyer | Sale Price | Title Company |
|---|---|---|---|
| Fang Da Guo | $200,000 | Lawyers Title Company | |
| Federal National Mortgage Association | $296,061 | Landsafe Title | |
| Pearl Alexander J I | $335,000 | First American Title |
Source: Public Records
Mortgage History
| Date | Status | Borrower | Loan Amount |
|---|---|---|---|
| Open | Fang Da Guo | $150,000 | |
| Previous Owner | Pearl Alexander J I | $66,980 | |
| Previous Owner | Pearl Alexander J I | $267,920 |
Source: Public Records
Tax History Compared to Growth
Tax History
| Year | Tax Paid | Tax Assessment Tax Assessment Total Assessment is a certain percentage of the fair market value that is determined by local assessors to be the total taxable value of land and additions on the property. | Land | Improvement |
|---|---|---|---|---|
| 2025 | $3,066 | $258,151 | $133,709 | $124,442 |
| 2024 | $3,066 | $253,090 | $131,088 | $122,002 |
| 2023 | $2,997 | $248,128 | $128,518 | $119,610 |
| 2022 | $2,915 | $243,264 | $125,999 | $117,265 |
| 2021 | $2,893 | $238,495 | $123,529 | $114,966 |
| 2020 | $2,857 | $236,051 | $122,263 | $113,788 |
| 2019 | $2,805 | $231,423 | $119,866 | $111,557 |
| 2018 | $2,622 | $226,886 | $117,516 | $109,370 |
| 2017 | $2,556 | $222,438 | $115,212 | $107,226 |
| 2016 | $2,514 | $218,077 | $112,953 | $105,124 |
| 2015 | $2,476 | $214,802 | $111,257 | $103,545 |
| 2014 | $2,436 | $210,595 | $109,078 | $101,517 |
Source: Public Records
Map
Nearby Homes
- 10026 Maya Linda Rd Unit 6101
- 10112 Caminito Volar
- 10143 Caminito Volar Unit 185
- 9785 Mesa Springs Way Unit 74
- 9755 Mesa Springs Way Unit 126
- 9504 Carroll Canyon Rd Unit 202
- 10224 Maya Linda Rd Unit 17
- 10248 Maya Linda Rd Unit 33
- 10249 Black Mountain Rd Unit Q3
- 10226 Black Mountain Rd Unit 78
- 10222 Black Mountain Rd Unit 69
- 10296 Black Mountain Rd Unit 220
- 10284 Black Mountain Rd Unit 198
- 10422 Londonderry Ave
- 10582 Caminito Glenellen
- 9774 Caminito Doha
- 10280 Caminito Rio Branco
- 10276 Caminito Covewood
- 10771 Black Mountain Rd Unit 58
- 10771 Black Mountain Rd Unit 92
- 10076 Maya Linda Rd Unit 1202
- 10076 Maya Linda Rd Unit 1205
- 10076 Maya Linda Rd Unit 1204
- 10076 Maya Linda Rd Unit 1203
- 10076 Maya Linda Rd Unit 1201
- 10076 Maya Linda Rd Unit 1106
- 10076 Maya Linda Rd Unit 1105
- 10076 Maya Linda Rd Unit 1104
- 10076 Maya Linda Rd Unit 1103
- 10076 Maya Linda Rd Unit 1102
- 10076 Maya Linda Rd Unit 1101
- 10066 Maya Linda Rd Unit 2201
- 10056 Maya Linda Rd
- 10066 Maya Linda Rd
- 10066 Maya Linda Rd Unit Mirabella Point
- 10026 Maya Linda Rd
- 10066 Maya Linda Rd
- 10056 Maya Linda Rd Unit 3204
- 10026 Maya Linda Rd Unit 6208
- 10026 Maya Linda Rd Unit 6207