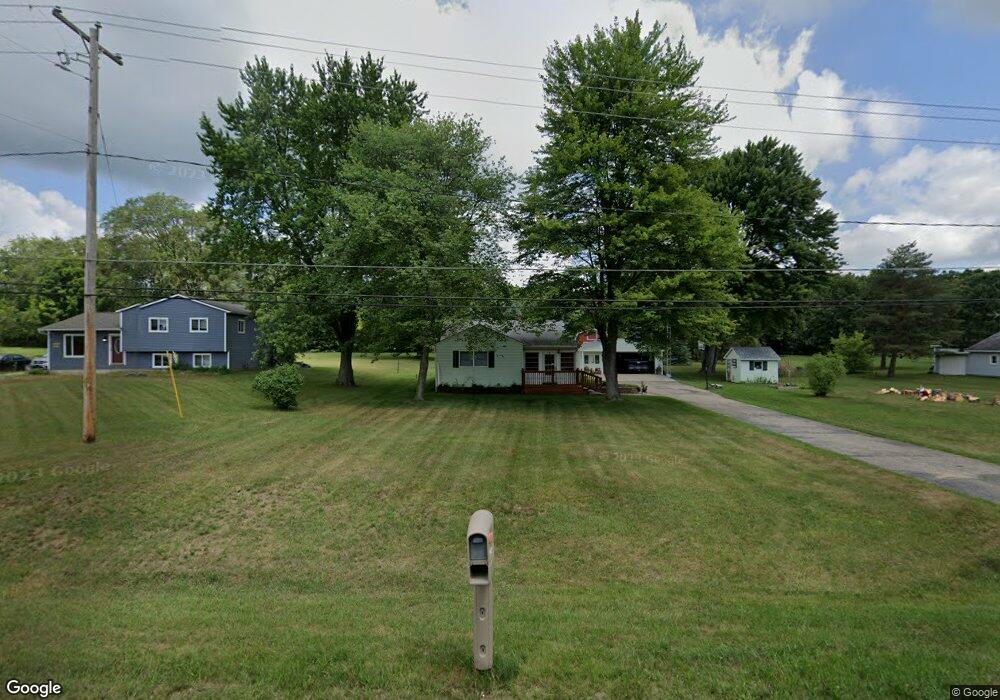
10079 E Mt Morris Rd Davison, MI 48423
Estimated Value: $162,003 - $271,000
3
Beds
1
Bath
965
Sq Ft
$218/Sq Ft
Est. Value
About This Home
This home is located at 10079 E Mt Morris Rd, Davison, MI 48423 and is currently estimated at $210,751, approximately $218 per square foot. 10079 E Mt Morris Rd is a home located in Genesee County with nearby schools including Columbiaville Elementary School, Otisville Elementary School, and Lakeville Middle School.
Ownership History
Date
Name
Owned For
Owner Type
Purchase Details
Closed on
Jun 24, 2011
Sold by
Fenner Grant L and Fenner Lyniece L
Bought by
Beach Traci R
Current Estimated Value
Purchase Details
Closed on
Jul 22, 2005
Sold by
Noe B Anderson Jr Revocable Trust and Fenner Ada M
Bought by
Fenner Grant L and Fenner Lyniece L
Purchase Details
Closed on
Jan 16, 2002
Sold by
Anderson Noe B and Anderson Donna M
Bought by
Noe B Anderson Jr Revocable Trust
Create a Home Valuation Report for This Property
The Home Valuation Report is an in-depth analysis detailing your home's value as well as a comparison with similar homes in the area
Home Values in the Area
Average Home Value in this Area
Purchase History
| Date | Buyer | Sale Price | Title Company |
|---|---|---|---|
| Beach Traci R | $70,000 | Lighthouse Title Inc | |
| Fenner Grant L | $103,000 | Guaranty Title Company | |
| Noe B Anderson Jr Revocable Trust | -- | Guaranty Title Company |
Source: Public Records
Tax History
| Year | Tax Paid | Tax Assessment Tax Assessment Total Assessment is a certain percentage of the fair market value that is determined by local assessors to be the total taxable value of land and additions on the property. | Land | Improvement |
|---|---|---|---|---|
| 2025 | $1,427 | $70,700 | $0 | $0 |
| 2024 | $420 | $66,700 | $0 | $0 |
| 2023 | $400 | $60,300 | $0 | $0 |
| 2022 | $1,247 | $52,600 | $0 | $0 |
| 2021 | $1,236 | $45,000 | $0 | $0 |
| 2020 | $366 | $42,300 | $0 | $0 |
| 2019 | $360 | $49,600 | $0 | $0 |
| 2018 | $793 | $37,500 | $0 | $0 |
| 2017 | $1,121 | $37,500 | $0 | $0 |
| 2016 | $1,136 | $37,600 | $0 | $0 |
| 2015 | $848 | $33,100 | $0 | $0 |
| 2014 | $327 | $28,400 | $0 | $0 |
| 2012 | -- | $29,900 | $29,900 | $0 |
Source: Public Records
Map
Nearby Homes
- 10287 Frances Rd
- 11074 E Mount Morris Rd
- 8054 N Gale Rd
- 11033 Carr Rd
- 8460 Gale Rd
- 8393 Gale Rd
- 6405 N State Rd
- 9465 Hubbard Rd
- 9377 Hubbard Rd
- 2444 E Stanley Rd
- 10275 Newland Dr
- 6152 N Gale Rd
- 5501 N State Rd
- 10374 Wilson Rd
- 12429 Mt Morris Rd
- V/L N Irish Rd
- 151 E Main St
- 5383 N Henderson Rd
- 5438 N Henderson Rd
- 7368 Vassar Rd
- 10079 E Mount Morris Rd
- 10067 E Mt Morris Rd
- 10067 E Mount Morris Rd
- 10097 E Mount Morris Rd
- 10047 E Mount Morris Rd
- 10047 Mt Morris
- 10096 E Mount Morris Rd
- 10080 E Mount Morris Rd
- 10113 E Mount Morris Rd
- 10048 E Mount Morris Rd
- 10048 E Mount Morris Rd
- 10106 E Mount Morris Rd
- 10106 E Mt Morris
- 10114 E Mt Morris Rd
- 10114 E Mount Morris Rd
- 10034 E Mount Morris Rd
- 10123 E Mount Morris Rd
- 10130 E Mount Morris Rd
- 8110 N State Rd
- 8236 N State Rd
Your Personal Tour Guide
Ask me questions while you tour the home.