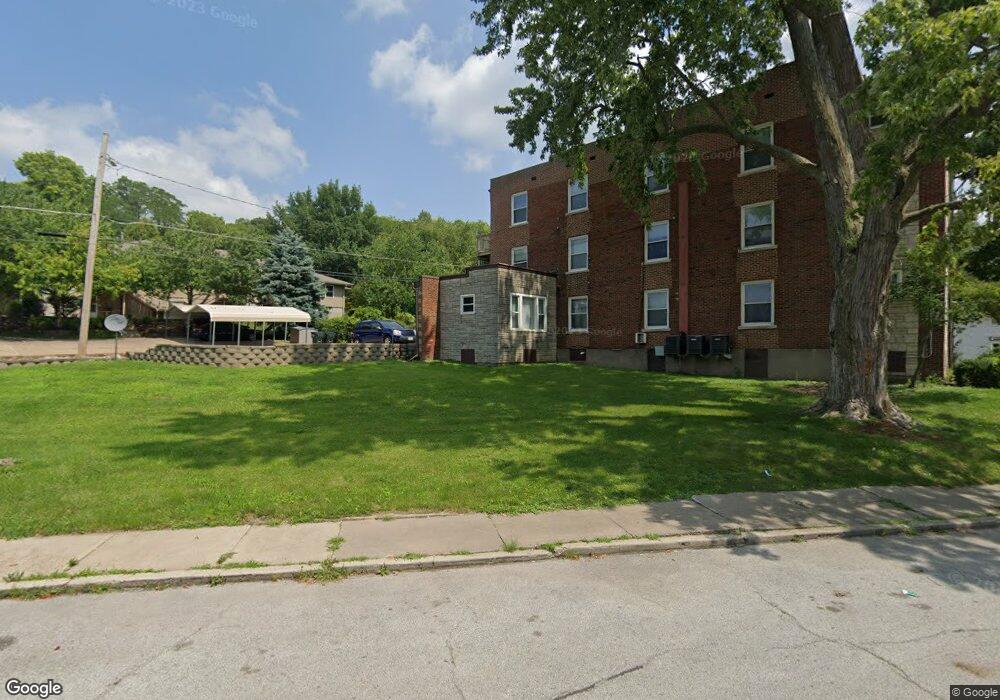
1008 Ash St Davenport, IA 52802
Central Davenport NeighborhoodEstimated Value: $30,064 - $85,000
2
Beds
1
Bath
1,088
Sq Ft
$58/Sq Ft
Est. Value
About This Home
This home is located at 1008 Ash St, Davenport, IA 52802 and is currently estimated at $63,021, approximately $57 per square foot. 1008 Ash St is a home located in Scott County with nearby schools including Jefferson Elementary School, Frank L. Smart Intermediate School, and Central High School.
Ownership History
Date
Name
Owned For
Owner Type
Purchase Details
Closed on
Dec 11, 2012
Sold by
B&Vpartners Llc 44
Bought by
Eeumenical Housing Development Group Cor
Current Estimated Value
Home Financials for this Owner
Home Financials are based on the most recent Mortgage that was taken out on this home.
Original Mortgage
$10,588
Interest Rate
3.31%
Mortgage Type
Unknown
Purchase Details
Closed on
Sep 7, 2012
Sold by
Hill Donnie Ray and Hill Johnnie Pearl
Bought by
B & V Partners Llc 44
Create a Home Valuation Report for This Property
The Home Valuation Report is an in-depth analysis detailing your home's value as well as a comparison with similar homes in the area
Home Values in the Area
Average Home Value in this Area
Purchase History
Date | Buyer | Sale Price | Title Company |
---|---|---|---|
Eeumenical Housing Development Group Cor | $7,500 | None Available | |
B & V Partners Llc 44 | -- | None Available |
Source: Public Records
Mortgage History
Date | Status | Borrower | Loan Amount |
---|---|---|---|
Open | Ehdg New Horizons Associates L | $509,548 | |
Closed | Warner Thomas | $10,588 |
Source: Public Records
Tax History Compared to Growth
Tax History
Year | Tax Paid | Tax Assessment Tax Assessment Total Assessment is a certain percentage of the fair market value that is determined by local assessors to be the total taxable value of land and additions on the property. | Land | Improvement |
---|---|---|---|---|
2024 | $40 | $2,310 | $2,310 | $0 |
2023 | $20 | $2,310 | $2,310 | $0 |
2022 | $20 | $920 | $920 | $0 |
2021 | $20 | $920 | $920 | $0 |
2020 | $20 | $920 | $920 | $0 |
2019 | $20 | $920 | $920 | $0 |
2018 | $20 | $920 | $920 | $0 |
2017 | $5 | $920 | $920 | $0 |
2016 | $20 | $920 | $0 | $0 |
2015 | $20 | $920 | $0 | $0 |
2014 | $20 | $13,570 | $0 | $0 |
2013 | $296 | $0 | $0 | $0 |
2012 | -- | $27,140 | $3,140 | $24,000 |
Source: Public Records
Map
Nearby Homes