Estimated Value: $209,075 - $241,000
4
Beds
2
Baths
1,716
Sq Ft
$130/Sq Ft
Est. Value
About This Home
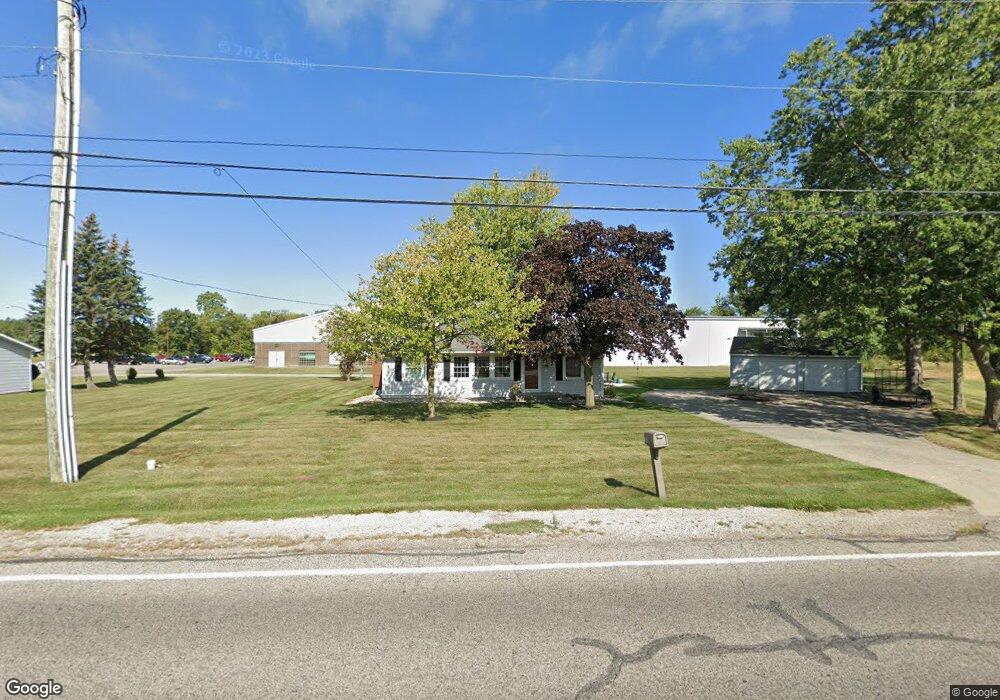
This home is located at 1008 Center St, Bryan, OH 43506 and is currently estimated at $222,269, approximately $129 per square foot. 1008 Center St is a home located in Williams County with nearby schools including Bryan Elementary PK-5, Washington Elementary School, and Bryan Middle School/High School.
Ownership History
Date
Name
Owned For
Owner Type
Purchase Details
Closed on
May 12, 2011
Sold by
May Ervin E and May Barbara A
Bought by
Harwell Joshua D
Current Estimated Value
Home Financials for this Owner
Home Financials are based on the most recent Mortgage that was taken out on this home.
Original Mortgage
$84,800
Outstanding Balance
$59,149
Interest Rate
4.96%
Mortgage Type
Purchase Money Mortgage
Estimated Equity
$163,120
Purchase Details
Closed on
Jan 26, 2010
Sold by
Fannie Mae
Bought by
May Ervin E and May Barbara A
Purchase Details
Closed on
Nov 23, 2009
Sold by
Wagner David L
Bought by
The Huntington National Bank
Purchase Details
Closed on
May 31, 2002
Sold by
Roan Pauline
Bought by
Wagner David L and Wagner Vivian
Purchase Details
Closed on
Jan 1, 1990
Bought by
Roan Pauline
Create a Home Valuation Report for This Property
The Home Valuation Report is an in-depth analysis detailing your home's value as well as a comparison with similar homes in the area
Home Values in the Area
Average Home Value in this Area
Purchase History
| Date | Buyer | Sale Price | Title Company |
|---|---|---|---|
| Harwell Joshua D | $106,800 | Upland Title Agency Llc | |
| May Ervin E | $46,300 | None Available | |
| The Huntington National Bank | $46,667 | None Available | |
| Wagner David L | $91,500 | -- | |
| Roan Pauline | -- | -- |
Source: Public Records
Mortgage History
| Date | Status | Borrower | Loan Amount |
|---|---|---|---|
| Open | Harwell Joshua D | $84,800 |
Source: Public Records
Tax History Compared to Growth
Tax History
| Year | Tax Paid | Tax Assessment Tax Assessment Total Assessment is a certain percentage of the fair market value that is determined by local assessors to be the total taxable value of land and additions on the property. | Land | Improvement |
|---|---|---|---|---|
| 2024 | $2,499 | $54,960 | $9,980 | $44,980 |
| 2023 | $2,499 | $44,000 | $10,330 | $33,670 |
| 2022 | $2,217 | $44,110 | $10,330 | $33,780 |
| 2021 | $2,223 | $44,110 | $10,330 | $33,780 |
| 2020 | $1,927 | $37,070 | $8,680 | $28,390 |
| 2019 | $1,912 | $37,070 | $8,680 | $28,390 |
| 2018 | $1,779 | $37,070 | $8,680 | $28,390 |
| 2017 | $1,726 | $33,320 | $8,680 | $24,640 |
| 2016 | $1,651 | $33,320 | $8,680 | $24,640 |
| 2015 | $1,678 | $33,320 | $8,680 | $24,640 |
| 2014 | $1,678 | $33,320 | $8,680 | $24,640 |
| 2013 | $1,684 | $33,320 | $8,680 | $24,640 |
Source: Public Records
Map
Nearby Homes
- 726 Crestview Ave
- 917 Wesley Ave
- 630 Center Ridge Rd
- 702 Center St
- 1006 Fairlawn St
- 1004 Greystone Dr
- 600 Louisiana Ave
- 401 Avenue A
- 1121 Town Line Rd Unit 160
- 817 Oakwood Ave
- 1202 Oakwood Ave
- 319 Newdale Dr
- 826 Parkview Ave
- 000 C R C (East 787)
- 000 C R C (West 828)
- 1006 Newdale Cir
- 615 S Portland St
- 317 W Perry St
- 311 Connin St
- 726 S Lynn St
- 1012 Center St
- 1016 Center St
- 1105 Alpine Dr
- 1020 Alpine Dr
- 910 Center St
- 908 Center St
- 1029 Center St
- 0 Center St Unit 6029550
- 0 Center St Unit 6009130
- 0 Center St Unit 5064925
- 0 Center St Unit 5083400
- 0 Center St Unit 6059438
- 1104 Alpine Dr
- 000 Markey Dr
- 1109 Alpine Dr
- 727 Center Ridge Rd
- 917 Markey Dr
- 925 Markey Dr
- 1114 Center St
- 726 Center Ridge Rd