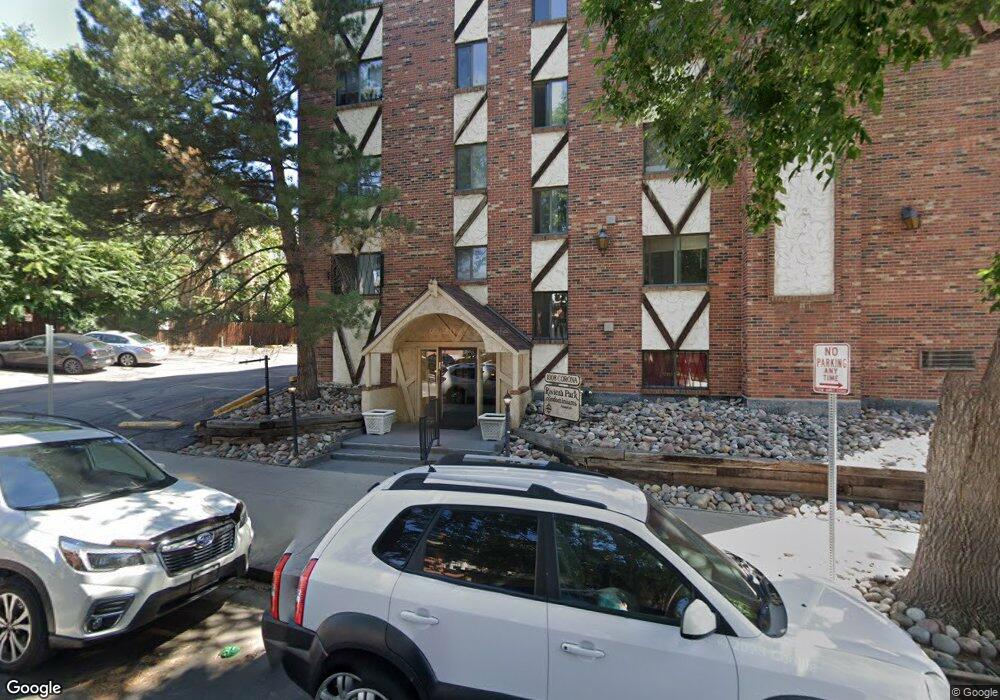
1008 Corona St Denver, CO 80218
Capitol Hill NeighborhoodEstimated Value: $239,000 - $246,000
1
Bed
1
Bath
589
Sq Ft
$413/Sq Ft
Est. Value
About This Home
This home is located at 1008 Corona St, Denver, CO 80218 and is currently estimated at $243,426, approximately $413 per square foot. 1008 Corona St is a home located in Denver County with nearby schools including Dora Moore ECE-8 School, Morey Middle School, and East High School.
Ownership History
Date
Name
Owned For
Owner Type
Purchase Details
Closed on
Feb 12, 2026
Sold by
Marcia Real Estate Llc
Bought by
Gallegos Elia Rodriguez and Gomez Teodulfo Correa
Current Estimated Value
Home Financials for this Owner
Home Financials are based on the most recent Mortgage that was taken out on this home.
Original Mortgage
$239,590
Outstanding Balance
$239,590
Interest Rate
6.15%
Mortgage Type
New Conventional
Estimated Equity
$3,836
Purchase Details
Closed on
Nov 18, 2025
Sold by
United Colorado Llc
Bought by
Marcia Real Estate Llc
Home Financials for this Owner
Home Financials are based on the most recent Mortgage that was taken out on this home.
Original Mortgage
$152,000
Interest Rate
6.3%
Mortgage Type
Construction
Purchase Details
Closed on
Jul 8, 2024
Sold by
Rohlk Kendra A
Bought by
Obrien Daniel Patrick and Obrien Lisa Marie
Create a Home Valuation Report for This Property
The Home Valuation Report is an in-depth analysis detailing your home's value as well as a comparison with similar homes in the area
Home Values in the Area
Average Home Value in this Area
Purchase History
| Date | Buyer | Sale Price | Title Company |
|---|---|---|---|
| Gallegos Elia Rodriguez | $247,000 | Chicago Title | |
| Marcia Real Estate Llc | $168,900 | Chicago Title | |
| United Colorado Llc | $143,200 | Land Title | |
| Obrien Daniel Patrick | $289,500 | Fitco |
Source: Public Records
Mortgage History
| Date | Status | Borrower | Loan Amount |
|---|---|---|---|
| Open | Gallegos Elia Rodriguez | $239,590 | |
| Previous Owner | Marcia Real Estate Llc | $152,000 |
Source: Public Records
Tax History
| Year | Tax Paid | Tax Assessment Tax Assessment Total Assessment is a certain percentage of the fair market value that is determined by local assessors to be the total taxable value of land and additions on the property. | Land | Improvement |
|---|---|---|---|---|
| 2025 | $1,131 | $18,530 | $2,050 | $2,050 |
| 2024 | $1,131 | $14,280 | $1,520 | $12,760 |
| 2023 | $1,107 | $14,280 | $1,520 | $12,760 |
| 2022 | $1,236 | $15,540 | $1,580 | $13,960 |
| 2021 | $1,192 | $15,980 | $1,620 | $14,360 |
| 2020 | $1,103 | $14,870 | $1,520 | $13,350 |
| 2019 | $1,072 | $14,870 | $1,520 | $13,350 |
| 2018 | $1,031 | $13,320 | $1,430 | $11,890 |
| 2017 | $1,027 | $13,320 | $1,430 | $11,890 |
| 2016 | $851 | $10,430 | $1,465 | $8,965 |
| 2015 | $815 | $10,430 | $1,465 | $8,965 |
| 2014 | $621 | $7,480 | $1,011 | $6,469 |
Source: Public Records
Map
Nearby Homes
- 1050 N Corona St Unit 215
- 1050 N Corona St Unit 308
- 1010 N Downing St Unit 9
- 951 N Corona St Unit 5
- 950 N Ogden St Unit 1
- 1107 N Downing St
- 1056 Marion St Unit 203
- 1056 N Marion St Unit 202
- 1057 N Emerson St Unit A
- 931 Emerson St Unit 1
- 855 Marion St
- 1151 N Marion St Unit 104
- 1050 N Lafayette St Unit 108
- 801 E 10th Ave
- 1166 N Downing St
- 1090 N Lafayette St Unit 504
- 1090 N Lafayette St Unit 205
- 831 N Clarkson St
- 1063 N Clarkson St Unit 12
- 1217 N Downing St Unit 4
- 1008 Corona St Unit 607
- 1008 Corona St Unit 605
- 1008 Corona St
- 1008 Corona St Unit 603
- 1008 Corona St
- 1008 Corona St
- 1008 Corona St
- 1008 Corona St Unit 507
- 1008 Corona St Unit 506
- 1008 Corona St
- 1008 Corona St Unit 504
- 1008 Corona St Unit 503
- 1008 Corona St
- 1008 Corona St
- 1008 Corona St
- 1008 Corona St Unit 407
- 1008 Corona St Unit 406
- 1008 Corona St Unit 404
- 1008 Corona St Unit 403
- 1008 Corona St Unit 402
Your Personal Tour Guide
Ask me questions while you tour the home.