Estimated Value: $704,000 - $834,000
2
Beds
2
Baths
1,389
Sq Ft
$538/Sq Ft
Est. Value
About This Home
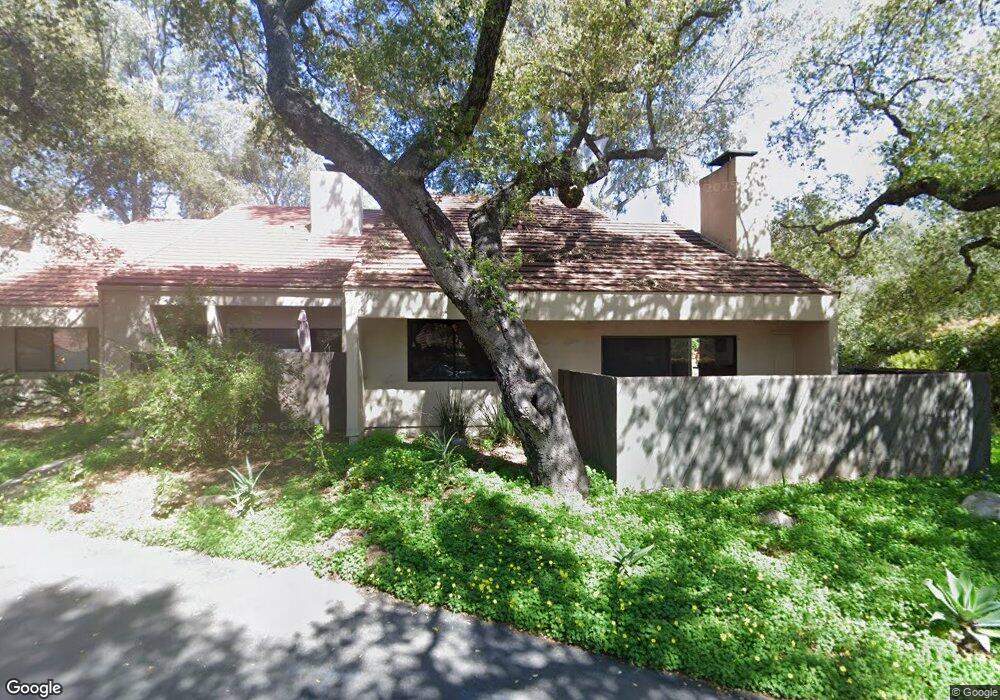
This home is located at 1008 Creekside Way Unit B, Ojai, CA 93023 and is currently estimated at $747,323, approximately $538 per square foot. 1008 Creekside Way Unit B is a home located in Ventura County with nearby schools including Mira Monte Elementary School, Meiners Oaks Elementary School, and Matilija Junior High.
Ownership History
Date
Name
Owned For
Owner Type
Purchase Details
Closed on
Nov 23, 2002
Sold by
Posa Anne E
Bought by
Parks Erica E
Current Estimated Value
Home Financials for this Owner
Home Financials are based on the most recent Mortgage that was taken out on this home.
Original Mortgage
$206,000
Outstanding Balance
$85,268
Interest Rate
5.86%
Estimated Equity
$662,055
Purchase Details
Closed on
Sep 28, 1998
Sold by
Herron James M
Bought by
Herron Nancy A
Purchase Details
Closed on
Sep 15, 1998
Sold by
Norcross Margaret A
Bought by
Posa Anne E
Purchase Details
Closed on
Sep 14, 1998
Sold by
Zielinski Robert and Zielinski Elizabeth E
Bought by
Norcross Margaret A
Purchase Details
Closed on
Sep 8, 1998
Sold by
Herron Nancy A and Herron Nanacy A
Bought by
Norcross Margaret A
Purchase Details
Closed on
Aug 30, 1998
Sold by
Posa Thomas
Bought by
Posa Anne E
Create a Home Valuation Report for This Property
The Home Valuation Report is an in-depth analysis detailing your home's value as well as a comparison with similar homes in the area
Home Values in the Area
Average Home Value in this Area
Purchase History
| Date | Buyer | Sale Price | Title Company |
|---|---|---|---|
| Parks Erica E | $300,000 | Gateway Title Company | |
| Herron Nancy A | -- | Old Republic Title Company | |
| Posa Anne E | $162,500 | Old Republic Title Company | |
| Norcross Margaret A | -- | Old Republic Title Company | |
| Norcross Margaret A | $54,500 | Old Republic Title Company | |
| Norcross Margaret A | $54,500 | Old Republic Title Company | |
| Posa Anne E | -- | Old Republic Title Company |
Source: Public Records
Mortgage History
| Date | Status | Borrower | Loan Amount |
|---|---|---|---|
| Open | Parks Erica E | $206,000 |
Source: Public Records
Tax History Compared to Growth
Tax History
| Year | Tax Paid | Tax Assessment Tax Assessment Total Assessment is a certain percentage of the fair market value that is determined by local assessors to be the total taxable value of land and additions on the property. | Land | Improvement |
|---|---|---|---|---|
| 2025 | $5,811 | $434,479 | $173,790 | $260,689 |
| 2024 | $5,811 | $425,960 | $170,382 | $255,578 |
| 2023 | $5,614 | $417,608 | $167,041 | $250,567 |
| 2022 | $5,547 | $409,420 | $163,766 | $245,654 |
| 2021 | $5,511 | $401,393 | $160,555 | $240,838 |
| 2020 | $5,381 | $397,278 | $158,909 | $238,369 |
| 2019 | $5,229 | $389,490 | $155,794 | $233,696 |
| 2018 | $5,176 | $381,854 | $152,740 | $229,114 |
| 2017 | $5,085 | $374,368 | $149,746 | $224,622 |
| 2016 | $4,739 | $367,028 | $146,810 | $220,218 |
| 2015 | $4,699 | $361,516 | $144,605 | $216,911 |
| 2014 | $4,433 | $354,436 | $141,773 | $212,663 |
Source: Public Records
Map
Nearby Homes
- 1008 Creekside Way
- 1008 Creekside Way Unit A
- 1008 Creekside Way Unit C
- 1008 Creekside Way Unit D
- 1008 Creekside Way Unit F
- 1008 Creekside Way Unit G
- 1014 Creekside Way
- 1014 Creekside Way Unit H
- 1014 Creekside Way Unit G
- 1014 Creekside Way Unit F
- 1014 Creekside Way Unit E
- 1014 Creekside Way Unit D
- 1014 Creekside Way Unit C
- 1014 Creekside Way Unit B
- 1014 Creekside Way Unit A
- 1014 Creekside D Way Unit D
- 1023 Cuyama Rd
- 1031 Cuyama Rd
- 210 Del Norte Rd
- 212 Del Norte Rd