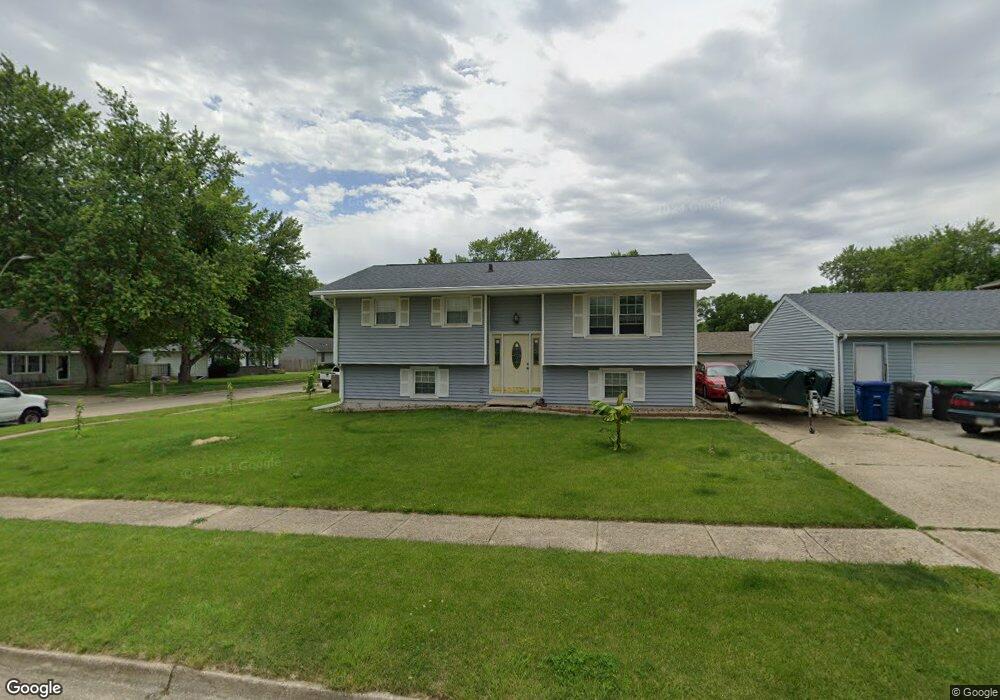
1008 E 40th Ct Des Moines, IA 50317
Valley High Manor NeighborhoodEstimated Value: $205,000 - $240,000
3
Beds
2
Baths
953
Sq Ft
$234/Sq Ft
Est. Value
About This Home
This home is located at 1008 E 40th Ct, Des Moines, IA 50317 and is currently estimated at $223,436, approximately $234 per square foot. 1008 E 40th Ct is a home located in Polk County with nearby schools including Willard Elementary School, Hoyt Middle School, and East High School.
Ownership History
Date
Name
Owned For
Owner Type
Purchase Details
Closed on
Sep 26, 2011
Sold by
Lab Investment Compant Inc 401K Plan
Bought by
Mlgs Llc
Current Estimated Value
Purchase Details
Closed on
Mar 23, 2011
Sold by
Lab Investment Company Inc
Bought by
Mlgs Llc
Home Financials for this Owner
Home Financials are based on the most recent Mortgage that was taken out on this home.
Original Mortgage
$67,324
Interest Rate
1%
Mortgage Type
Seller Take Back
Purchase Details
Closed on
Mar 21, 2011
Sold by
The Secretary Of Veterans Affairs
Bought by
Lab Investment Company Inc
Home Financials for this Owner
Home Financials are based on the most recent Mortgage that was taken out on this home.
Original Mortgage
$67,324
Interest Rate
1%
Mortgage Type
Seller Take Back
Purchase Details
Closed on
Aug 5, 2010
Sold by
Pnc Mortgage
Bought by
Secretary Of Veterans Affairs
Purchase Details
Closed on
Jul 15, 2010
Sold by
Earlywine Brian Paul and Earlywine Sherry A
Bought by
National City Real Estate Services Llc
Create a Home Valuation Report for This Property
The Home Valuation Report is an in-depth analysis detailing your home's value as well as a comparison with similar homes in the area
Home Values in the Area
Average Home Value in this Area
Purchase History
| Date | Buyer | Sale Price | Title Company |
|---|---|---|---|
| Mlgs Llc | $67,000 | None Available | |
| Mlgs Llc | $67,324 | None Available | |
| Lab Investment Company Inc | -- | None Available | |
| Secretary Of Veterans Affairs | $100,000 | None Available | |
| National City Real Estate Services Llc | $100,287 | None Available |
Source: Public Records
Mortgage History
| Date | Status | Borrower | Loan Amount |
|---|---|---|---|
| Previous Owner | Mlgs Llc | $67,324 |
Source: Public Records
Tax History
| Year | Tax Paid | Tax Assessment Tax Assessment Total Assessment is a certain percentage of the fair market value that is determined by local assessors to be the total taxable value of land and additions on the property. | Land | Improvement |
|---|---|---|---|---|
| 2025 | $3,408 | $198,100 | $35,000 | $163,100 |
| 2024 | $3,408 | $173,200 | $30,100 | $143,100 |
| 2023 | $3,690 | $173,200 | $30,100 | $143,100 |
| 2022 | $3,662 | $156,600 | $28,300 | $128,300 |
| 2021 | $3,458 | $156,600 | $28,300 | $128,300 |
| 2020 | $3,594 | $138,600 | $24,900 | $113,700 |
| 2019 | $3,182 | $138,600 | $24,900 | $113,700 |
| 2018 | $3,150 | $118,400 | $20,800 | $97,600 |
| 2017 | $3,264 | $118,400 | $20,800 | $97,600 |
| 2016 | $3,180 | $120,700 | $20,900 | $99,800 |
| 2015 | $3,180 | $120,700 | $20,900 | $99,800 |
| 2014 | $3,156 | $118,800 | $20,600 | $98,200 |
Source: Public Records
Map
Nearby Homes
- 1200 Williams St
- 1233 Williams St
- 4208 Valley Cir
- 1220 E 38th St
- 1320 E 40th St
- 4212 Valley Cir
- 3700 E University Ave
- 3809 Indianapolis Ave
- 3910 Indianapolis Ave
- 1319 E 37th St
- 1271 E 36th St
- 1485 Springs Dr
- 4430 Cameron Swing
- 3403 Dubuque Ave
- 4535 Zilker Dr
- 1315 E 33rd Ct
- 1257 E 33rd St
- 4585 Houck Dr
- 1337 E 33rd St
- 4550 Fairview Dr
Your Personal Tour Guide
Ask me questions while you tour the home.